Consider the function
w(t)=0.03t^4-0.81t^3+7.55t^2-26.62t+44
which represents the number of workers, w, at a job site thours after 6:00 a.m.
What is the difference between w(4)and w(8)?
A company provides internet service to approximately 1,050 customers each year. The table shows the percentage of customers with fiber internet each year since 2020.
Years since 2020 Percent of Customers with Fiber
0 19
1 28
2 40
3 57
What was the approximate number of customers with fiber internet in 2023?
The figure displays the graphs of two functions representing the heights, h_1and h_2, in feet, of two balls tseconds after being launched.
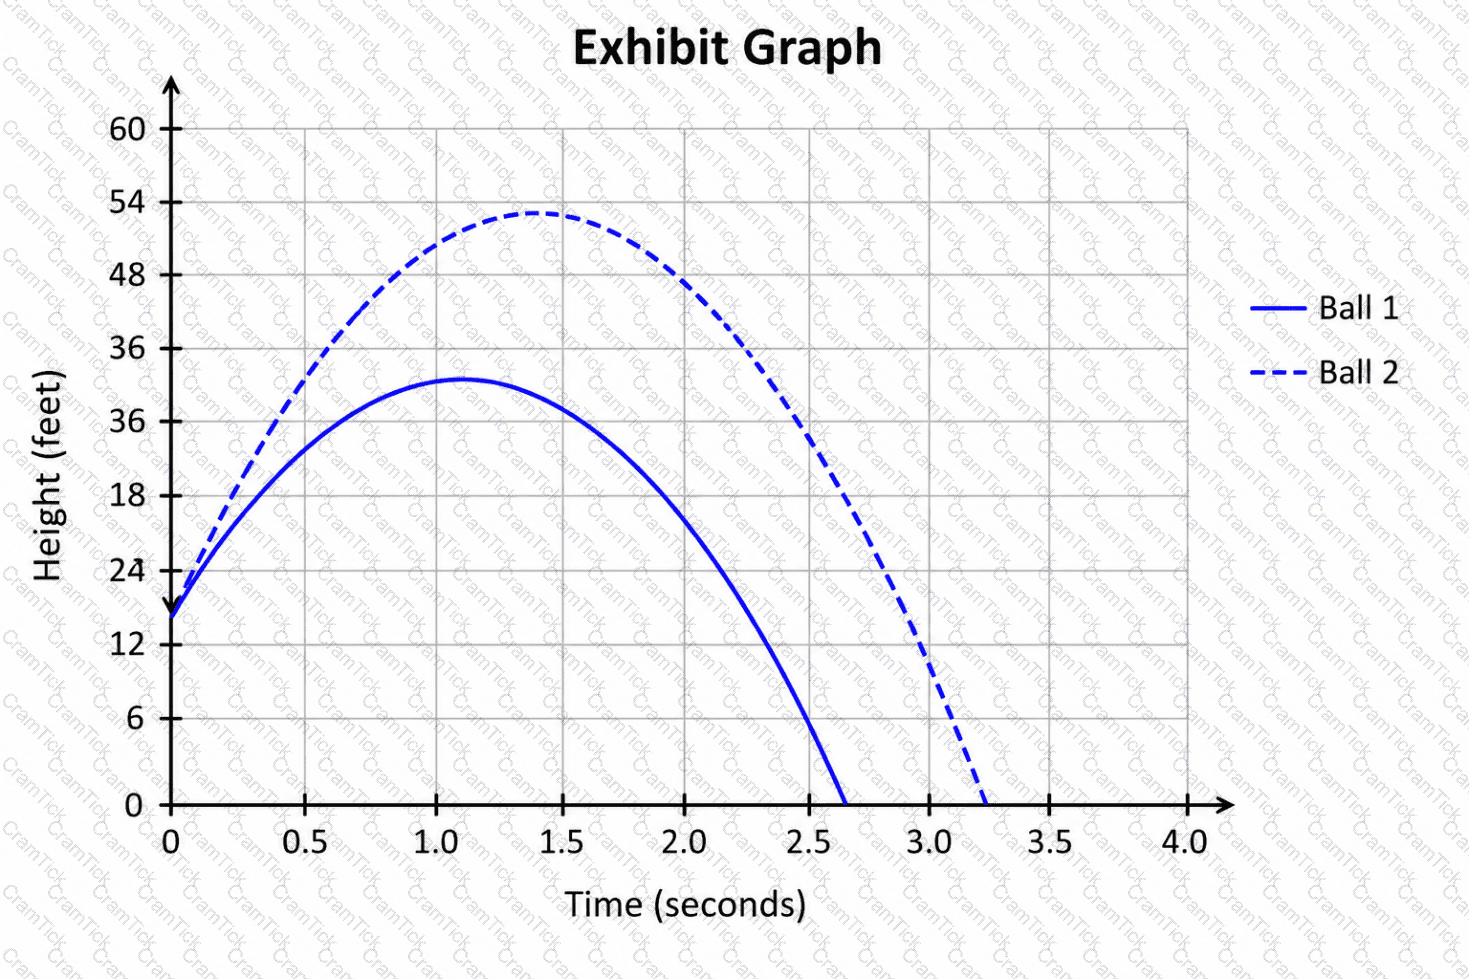
Which ball was lower 0.9seconds after being launched?
The graph shows the estimated wait time, in minutes, based on the number of hours after 7:00 a.m.
What is the average rate of change of the wait time from point Ato point B?
After a water tank starts leaking, the amount of water in the tank is modeled by the exponential function that is graphed.
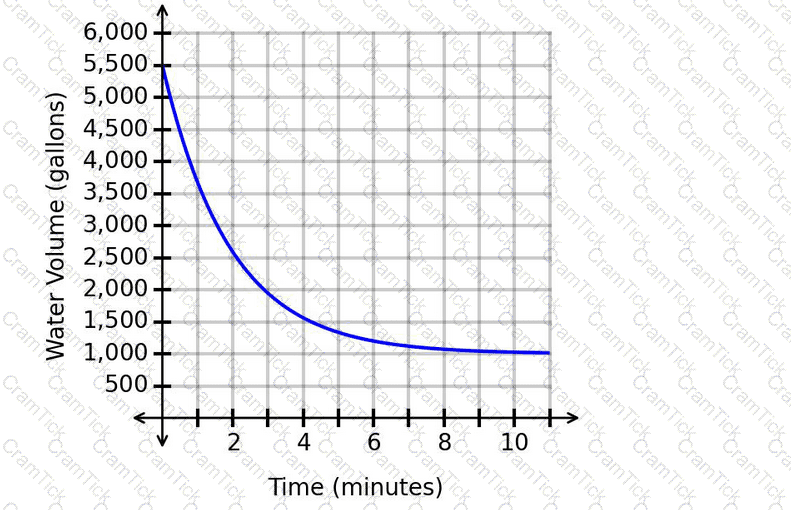
Which statement is justified considering the location of the horizontal asymptote?
The function P(t) represents the yearly profit, in millions of dollars, for a clothing store since opening. The graph of P(t) is shown.
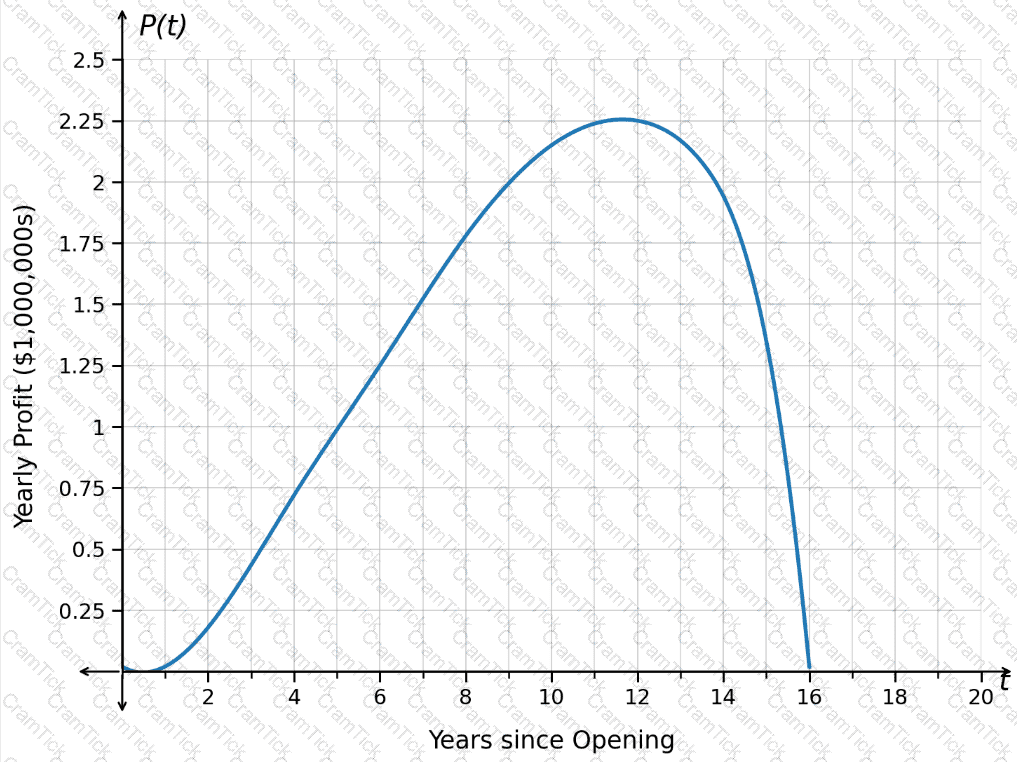
How should the maximum value be interpreted?
The number of property sales in a region this year is expected to be 9 more than the number of property sales in the region last year. The function H(x) represents the number of property sales this year, where x represents the number of properties sold last year.
Which notation represents the number of property sales this year, given that the number of properties sold last year was 140?
A small business is tracking the number of client accounts it manages over time. The graph shows the relationship between time and the number of client accounts the small business manages.
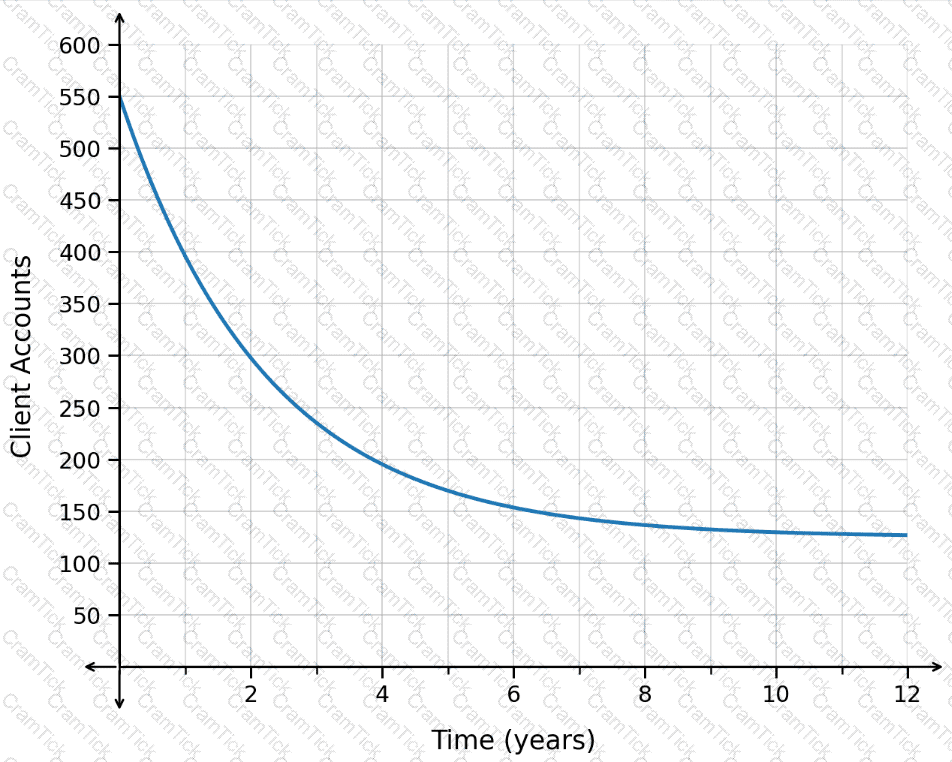
What is the equation of the horizontal asymptote?
The function N(t)models the number of subscribers to a virtual newsletter over time. The graph of N(t)is shown. The horizontal axis represents the number of years since the newsletter started, and the vertical axis represents the number of subscribers, in thousands.
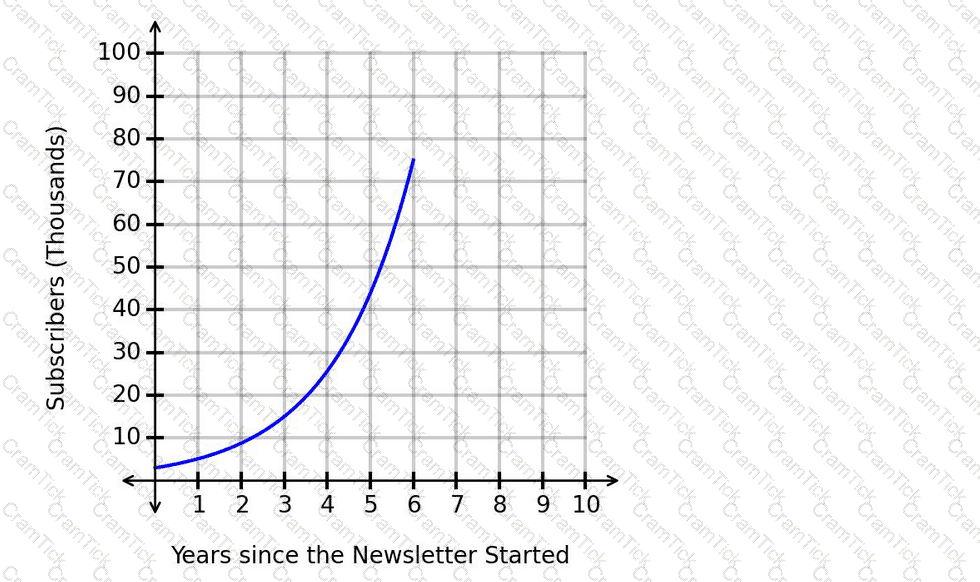
How is the number of subscribers changing over time based on the graph?
The number of comments on a social media post is represented by the logistic function f(x), whose graph is shown, where xrepresents the number of days since the post was created and f(x)represents the number of comments on day x.
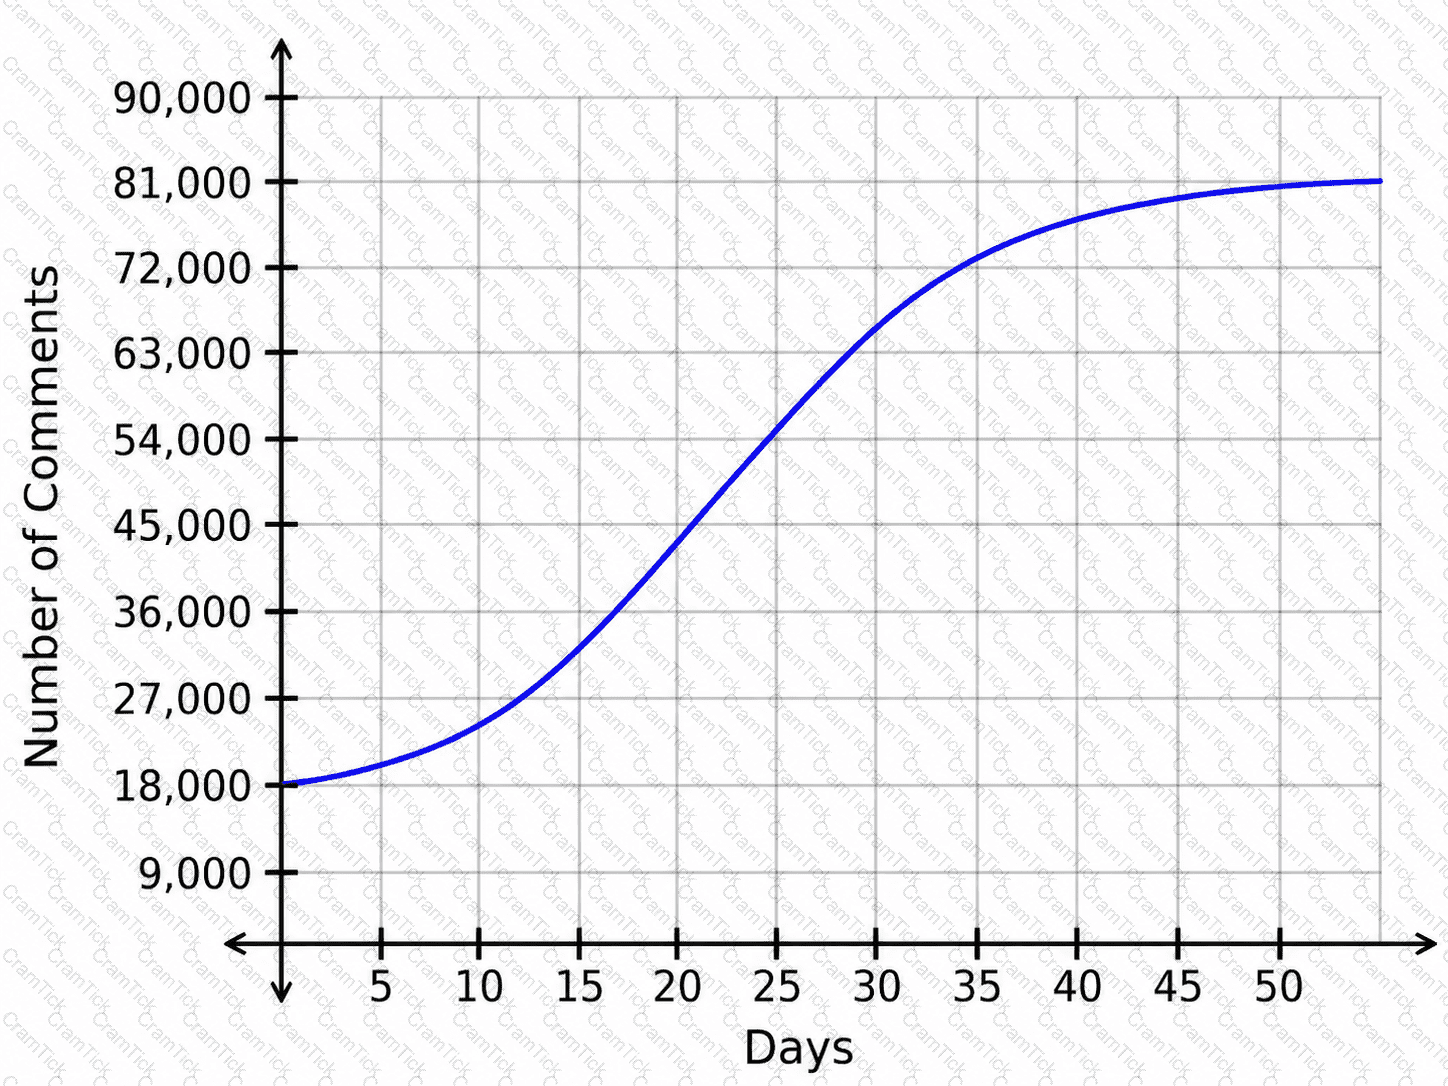
How does the number of comments change as time progresses from day 1 to day 17?
The graph shows the number of user accounts on a social media website over time.
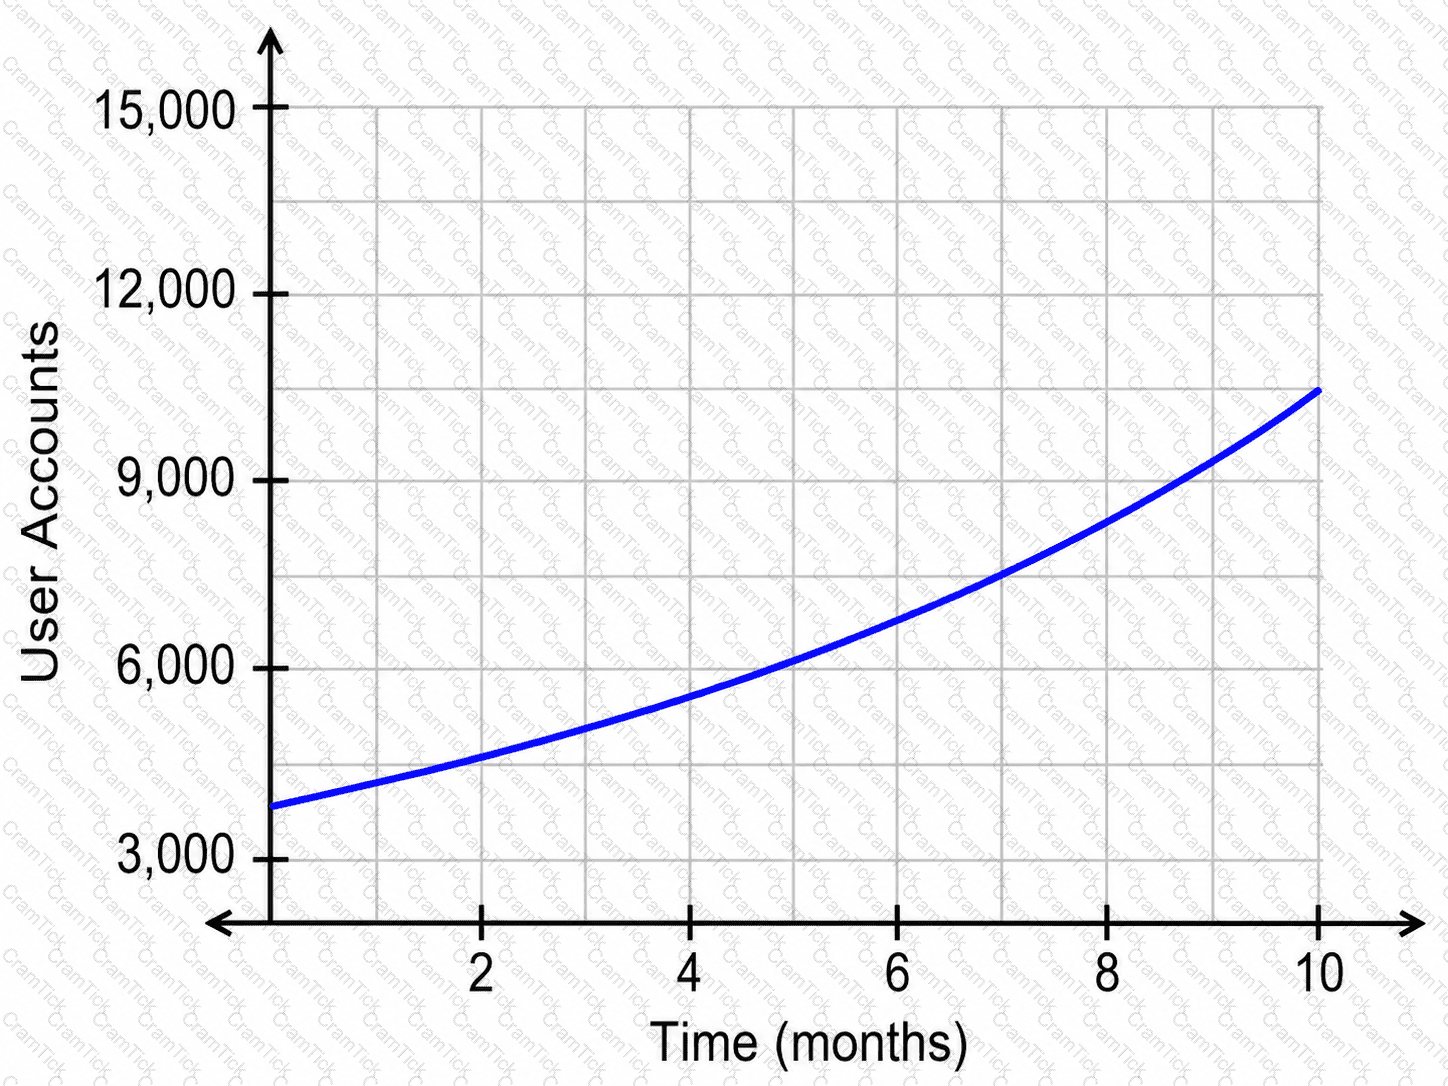
When did the number of user accounts reach 4,500?
The number of daily raffle tickets sold, R(d), for a fundraiser is represented by the graph, with the number of days since the beginning of the month along the horizontal axis and the number of raffle tickets sold for the day along the vertical axis.
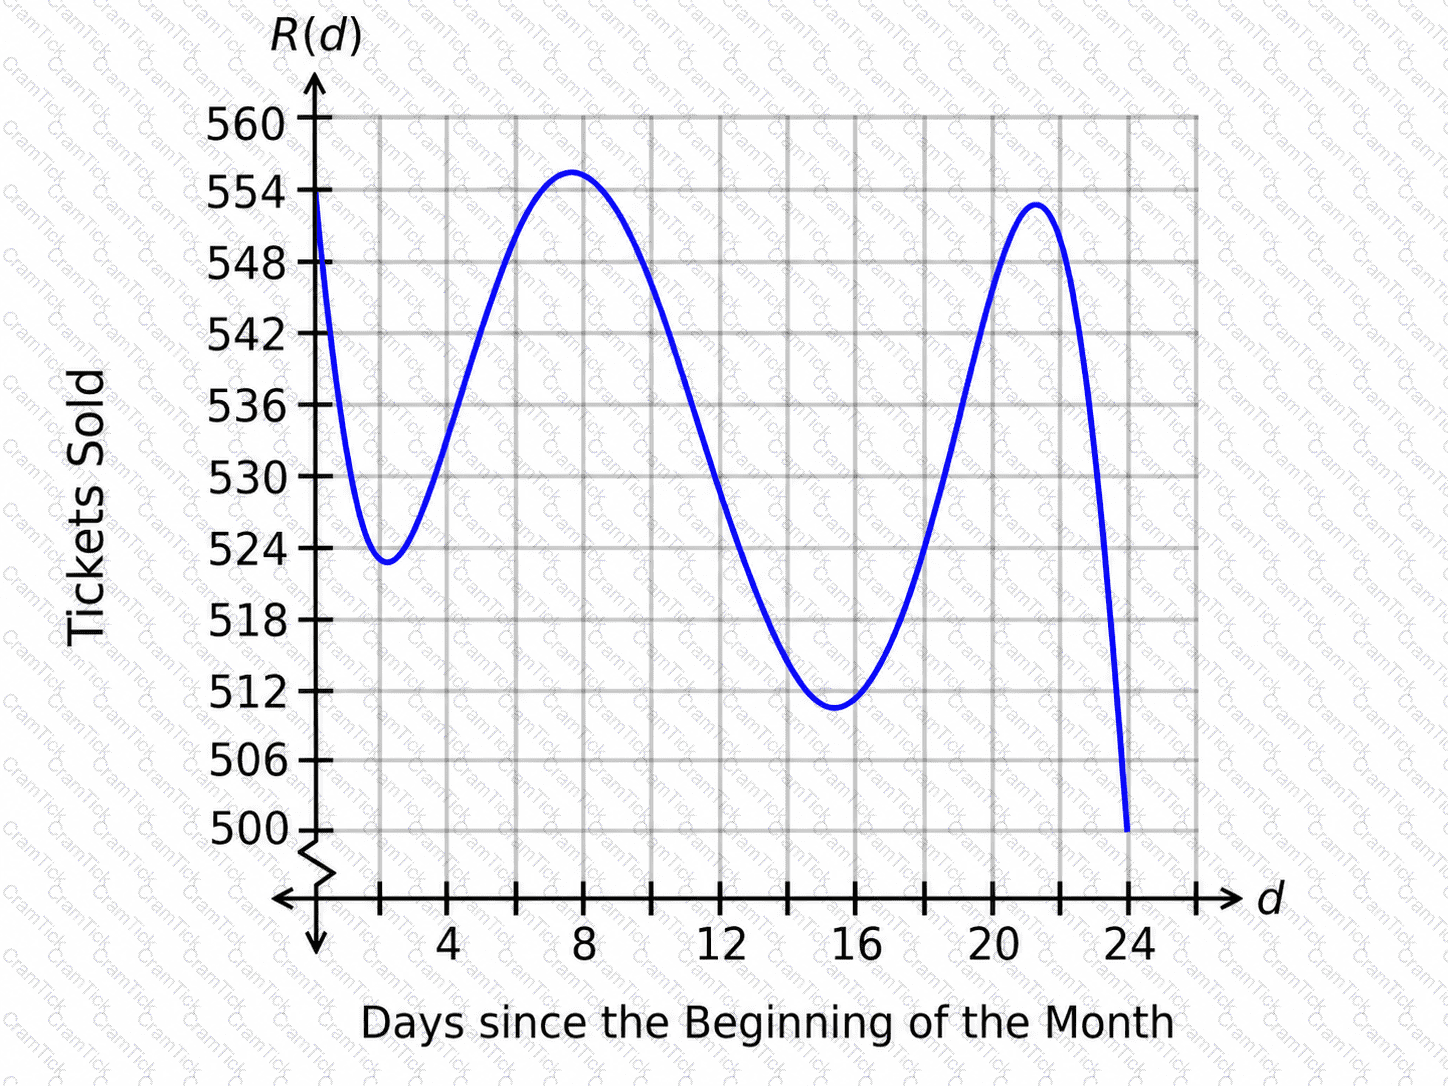
How can the concavity be described from d=0to d=4.4?
The scatterplot shows data on the population of rabbits in a nature preserve. The graphed regression function has an r^2value of 0.94.
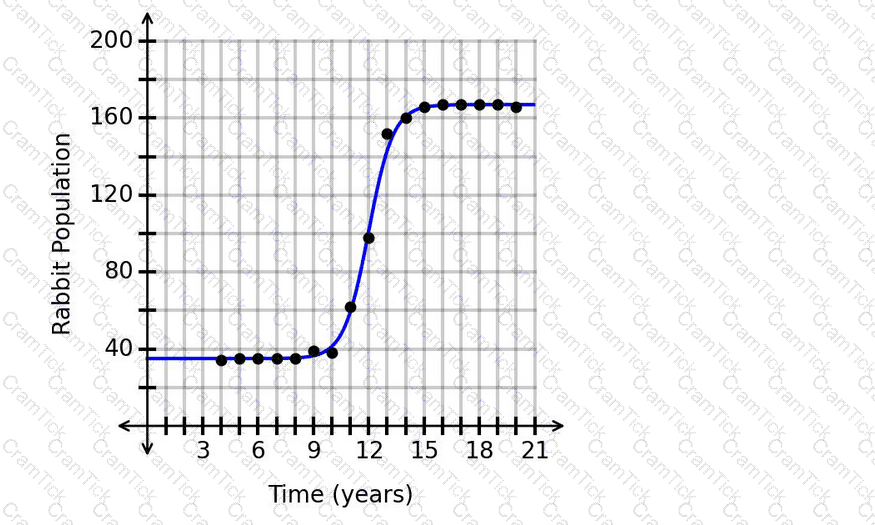
What is the appropriate range of x-values for extrapolation?
The function f(z) represents the relationship between the number of units in two inventories, where z is the number of units in inventory A and f(z) is the number of units in inventory B. The number of units in inventory B is 2 more than the number of units in inventory A. Which function represents this situation?
A researcher collected data on the number of books donated per month to a thrift store over time. The results are shown in the scatterplot. A regression function is graphed with r
2
=0.99.
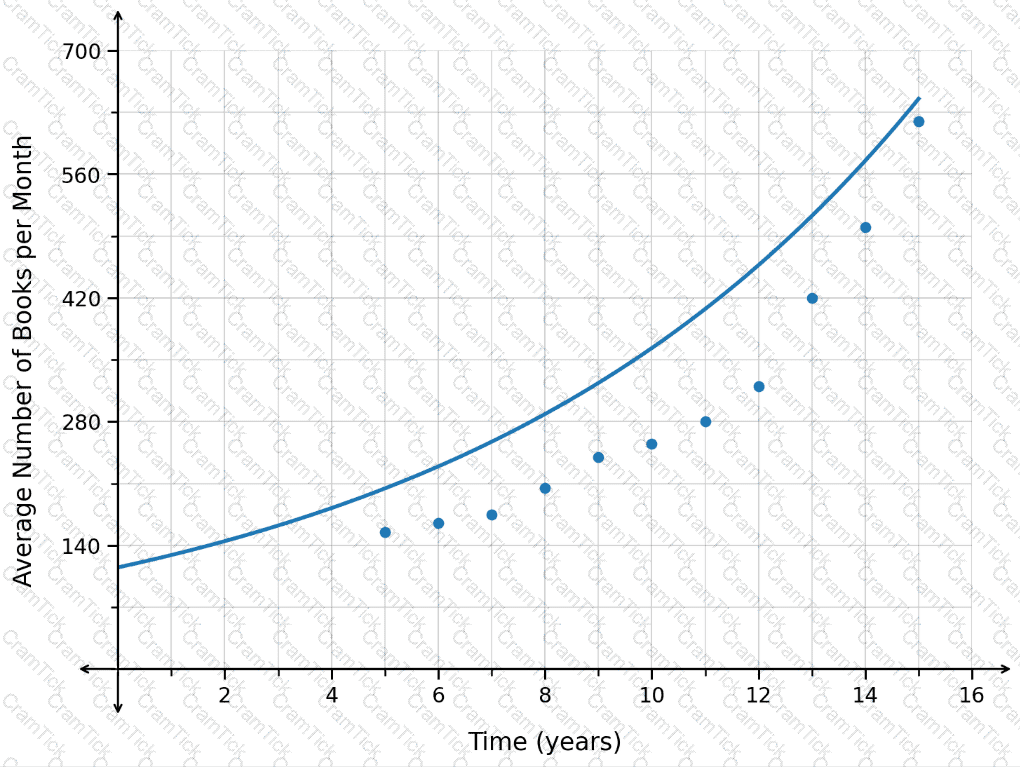
Which range of x-values is appropriate for extrapolation?
The traffic flow on a roadway after 8:00 a.m. is modeled by the graphed exponential function.
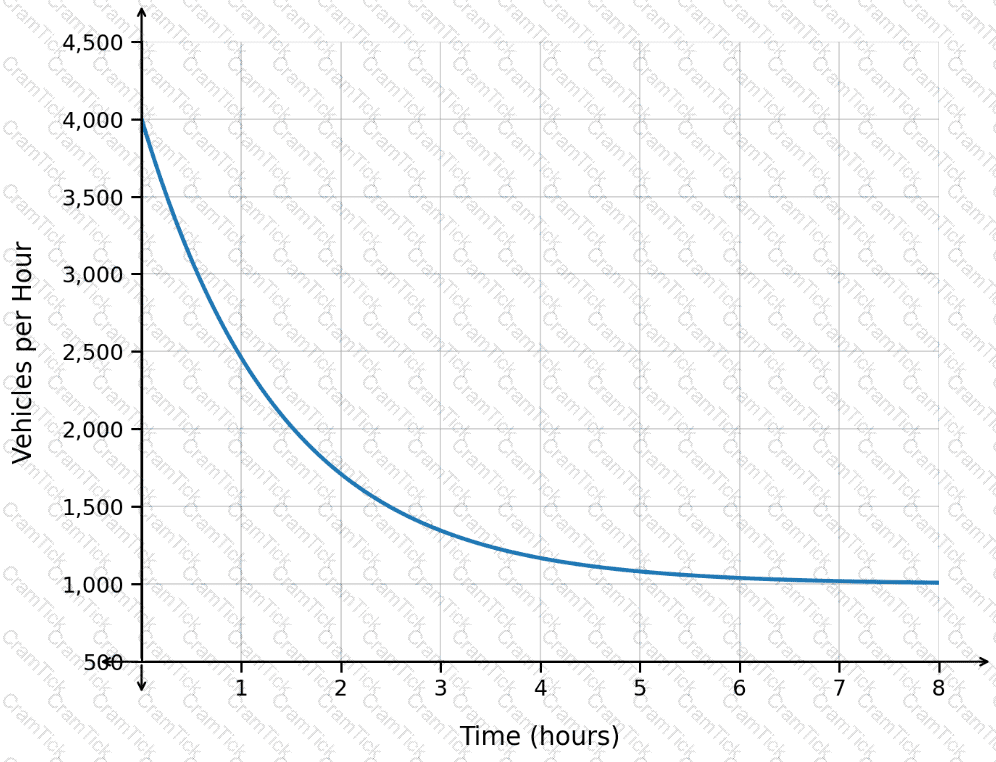
Which conclusion is valid, based on the horizontal asymptote?
The populations, in thousands, of two towns are shown in the graph, where the horizontal axis measures the time in years.
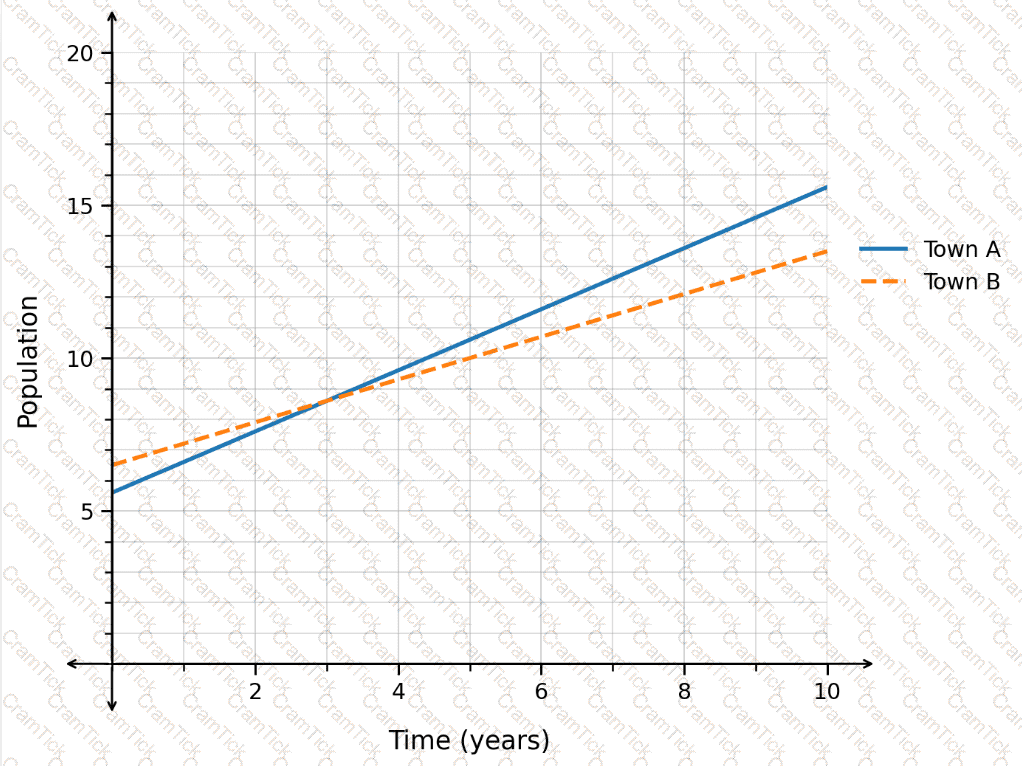
Which town’s population is growing at a faster rate?
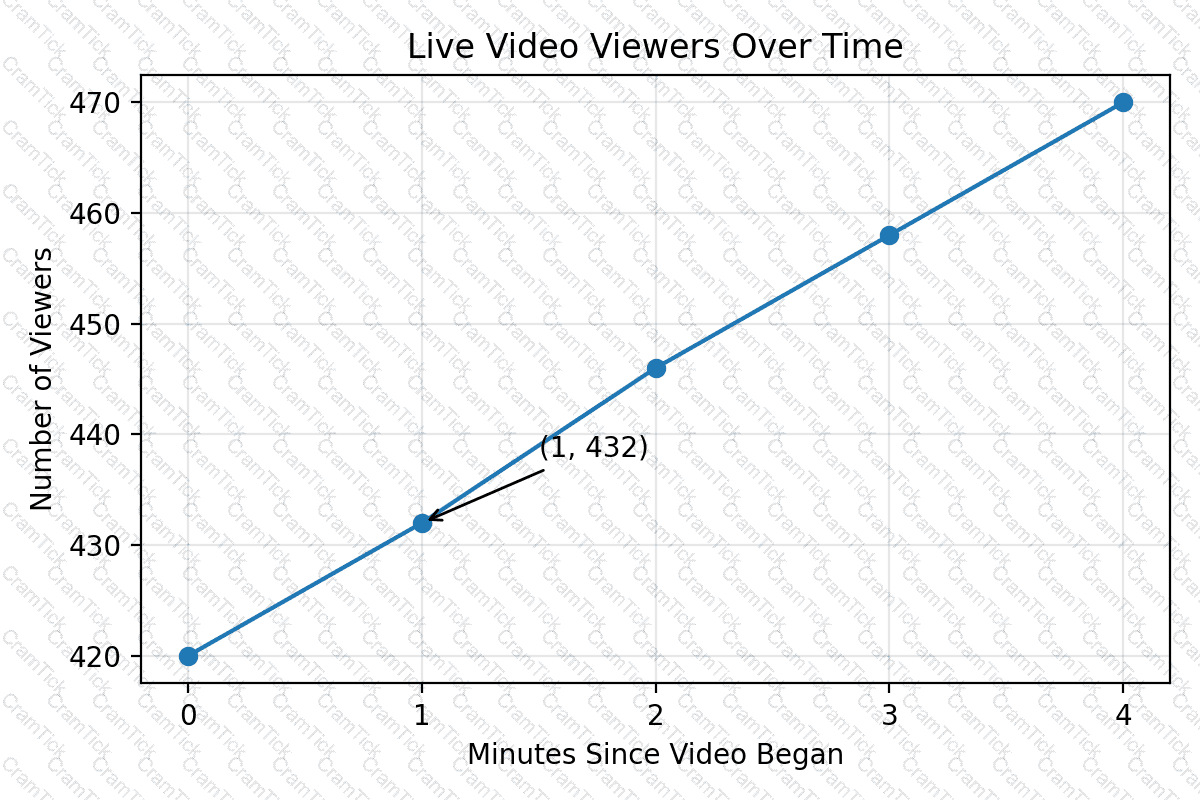
The graph shows the number of people watching a live video. The number of minutes since the video began is on the horizontal axis, and the number of viewers is on the vertical axis. When were there 432 viewers?
Exhibit:
A researcher collected data on the number of members in a national association over time. The results are shown in the scatterplot. The graphed regression function has an r^2value of 0.54.
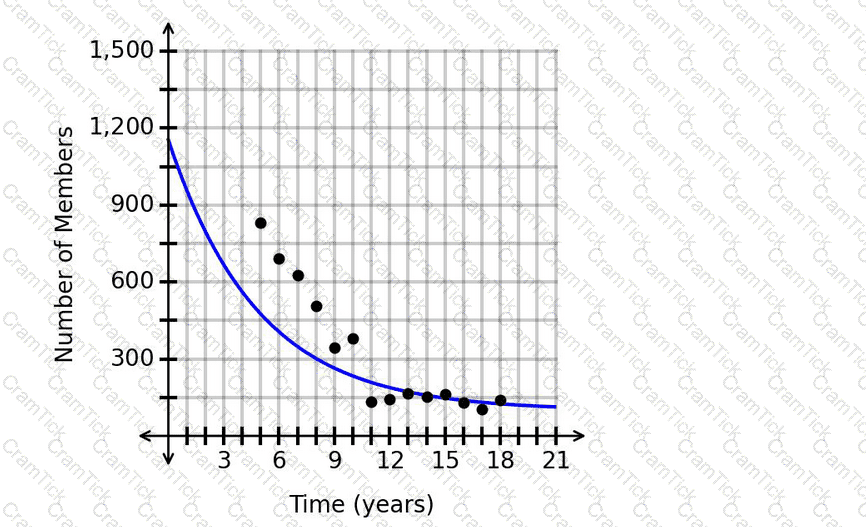
Is it appropriate to make a prediction for the number of members after 20.6years?
The function
c(t)=-0.01t^4+0.25t^3-2.33t^2+9.02t+8
represents the number of active shopping carts, c, on a website thours after 8:00 a.m.
What is the difference between c(6)and c(8)?
An exponential growth function can be used to model the number of bacteria in a population. The function
G(t)=1,600× 〖 1.31 〗 ^t
is the model, with Grepresenting the number of bacteria cells and trepresenting the time in minutes.
What is the size of the population after 25 minutes?
Consider the graph of x(t) shown. The function represents the number of users, x, watching a live video t hours after 9:00 a.m.
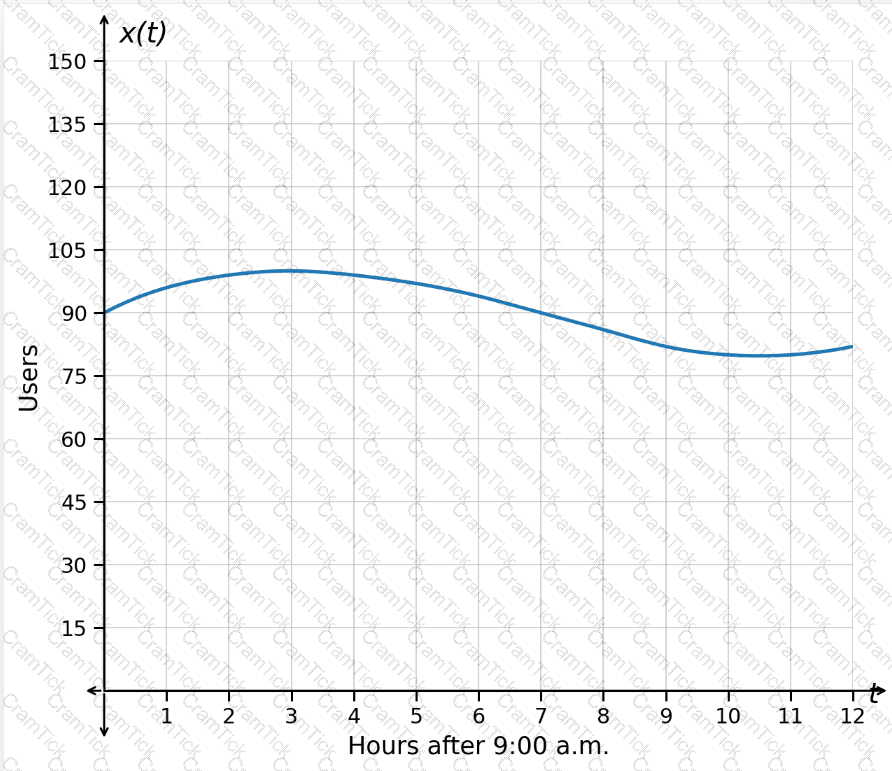
Which interval represents a range of values for which the number of users is decreasing slower and slower?
The spread of two viruses within a single population is modeled using the functions in the graph.
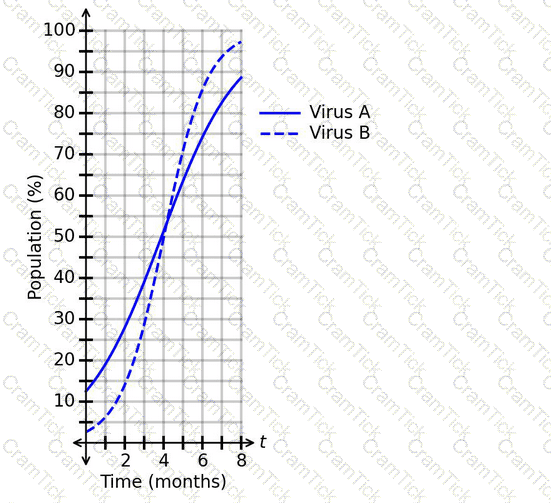
What is a correct conclusion based on the graph?
The scatterplot shows data on the popularity of a blog post over time. The graphed regression function has an r
2
value of 0.42.
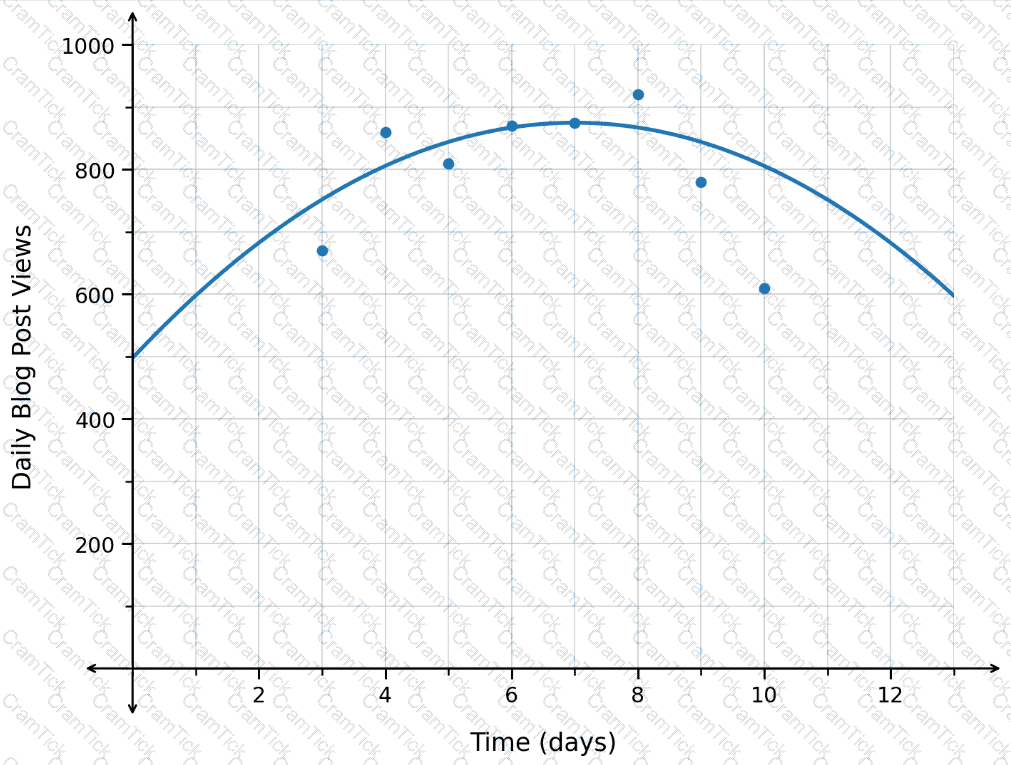
Is it appropriate to make a prediction for the number of daily blog post views after 12.4 days?
The function P(t)represents the daily profit, in hundreds of dollars, for a museum since opening. The graph of P(t)is shown.
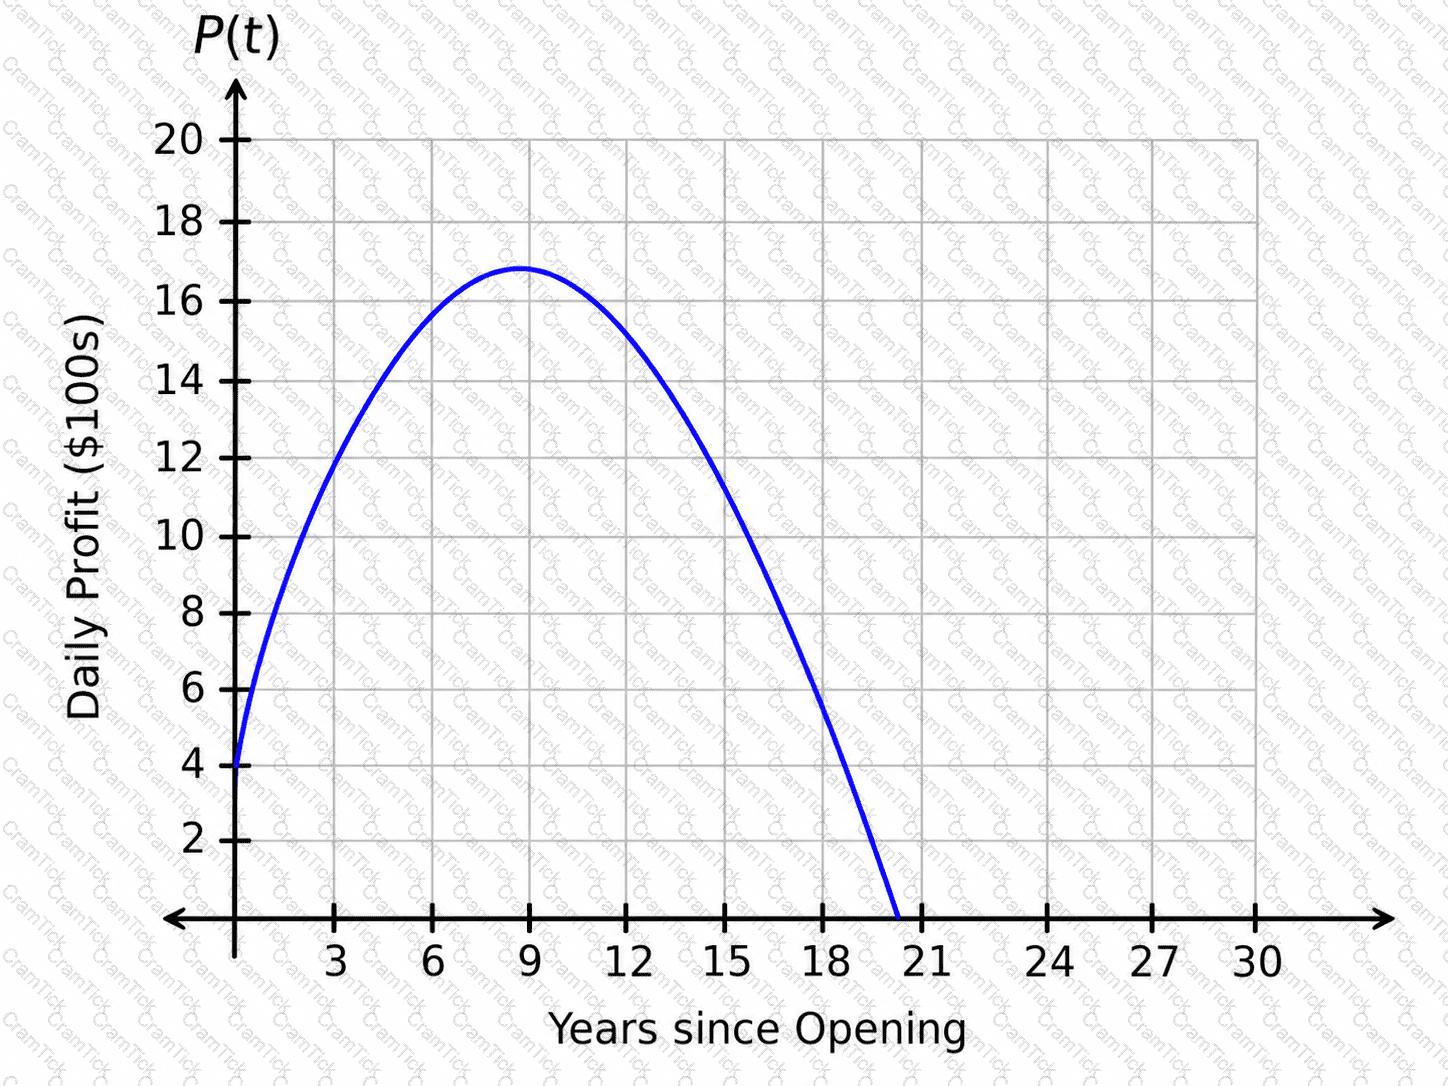
What is the correct interpretation of the maximum value?
The weight of a radioactive sample is given by the function
W(x)=740× 〖 0.87 〗 ^x
where xis the time, in years, and Wis the weight of the sample, in ounces.
What is the weight of the sample when x=3?
The figure shows the graph of p(t), which represents the number of people, p, at a gym thours after 7:00 a.m.
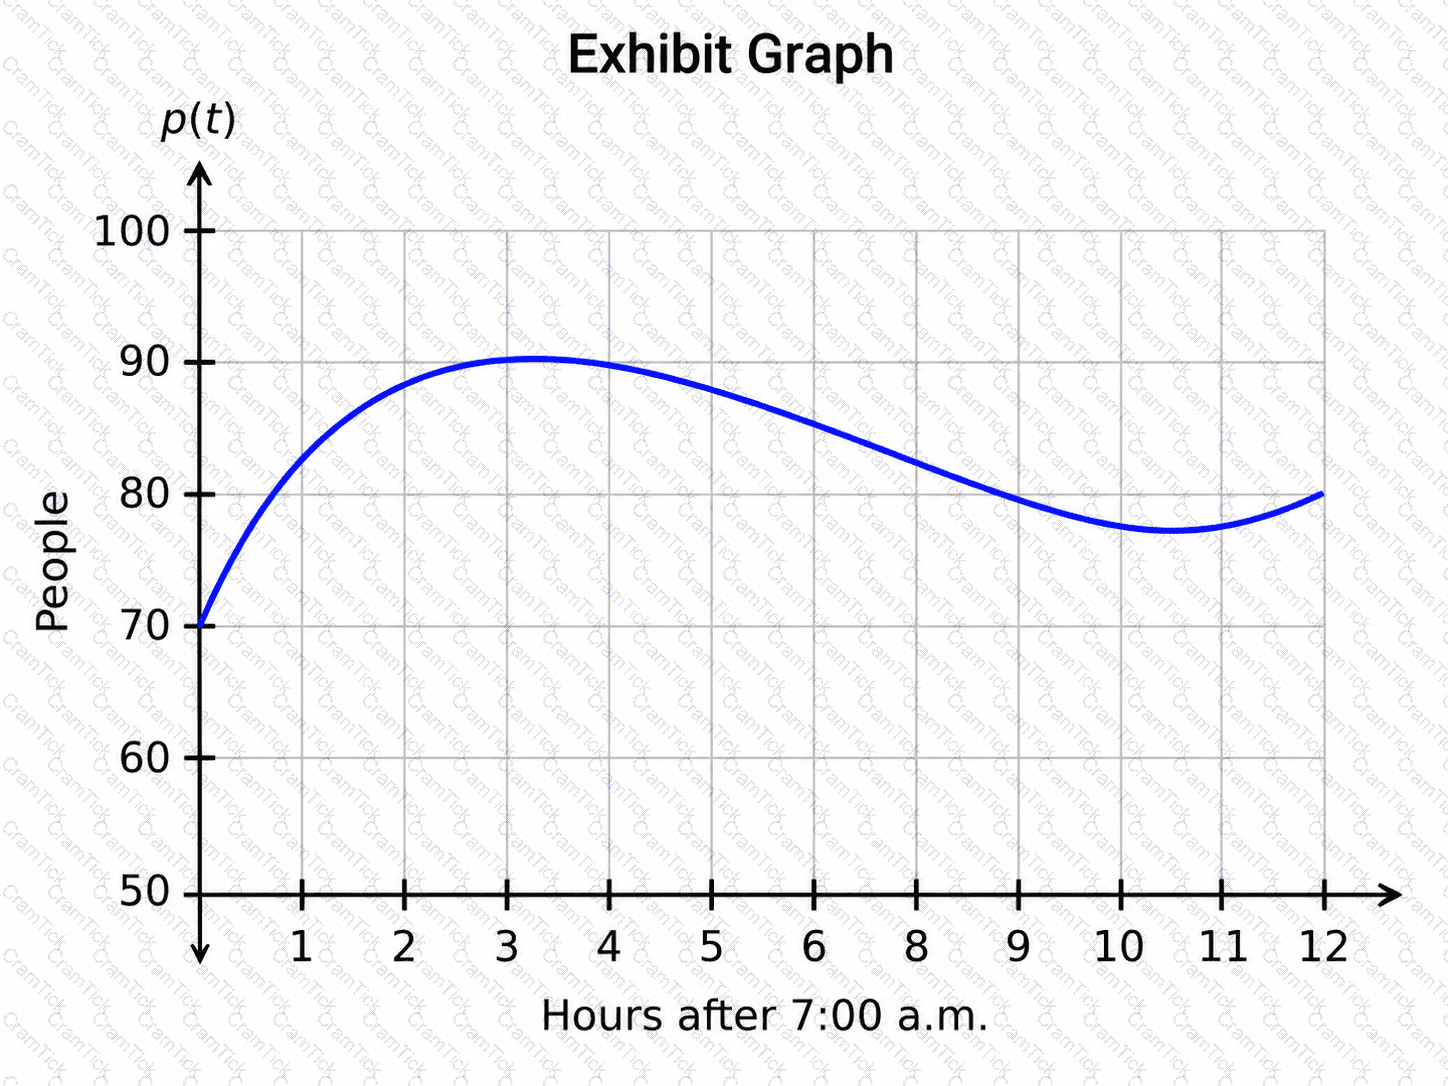
How should the concavity between t=1.3and t=3.4be interpreted?
The number of property sales in a region this year is expected to be 6 less than the number of property sales in the region last year. The function H(x)represents the number of property sales this year, where xrepresents the number of properties sold last year.
Which notation represents the number of property sales this year, given that the number of properties sold last year was 330?
The graphed function n(t)represents the number of animals, n, at a feeding station thours after 5:00 a.m. The plotted points Aand Bhave coordinates (1│10.6)and (8│6.59).
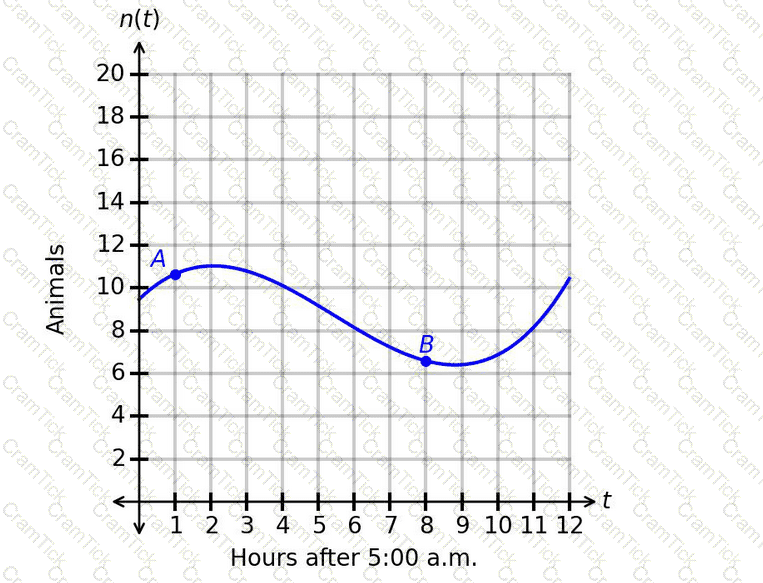
Which statement gives the correct interpretation of the average rate of change of the number of animals over the interval from point Ato point B?
The data in the scatterplot represents the number of people working at a research station over time. The graphed regression function has an r
2
value of 0.96. The predicted number of people working at the research station after 18.1 years is 541.
Is this prediction appropriate?
A new company just launched and is using the function M(t)to predict its market share after tyears. The graph of M(t)is shown.
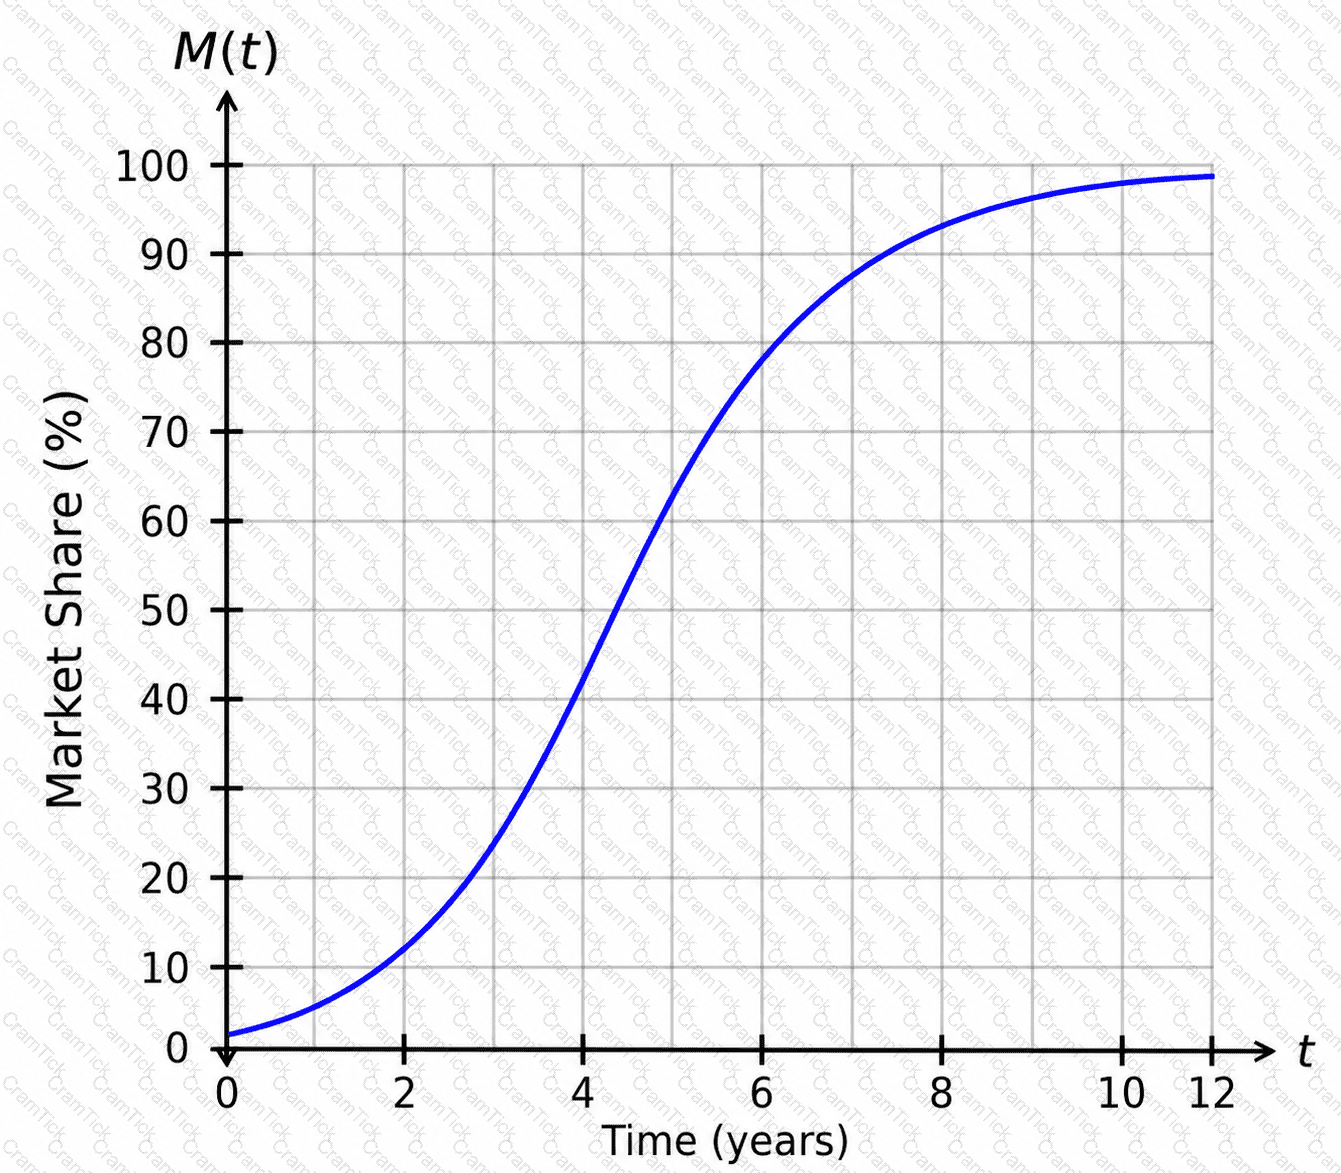
When should the company expect to have a market share of 60%?
The function a(x)represents the value of an investment account, where xis the number of years since the account was opened. The graph of the function is shown.
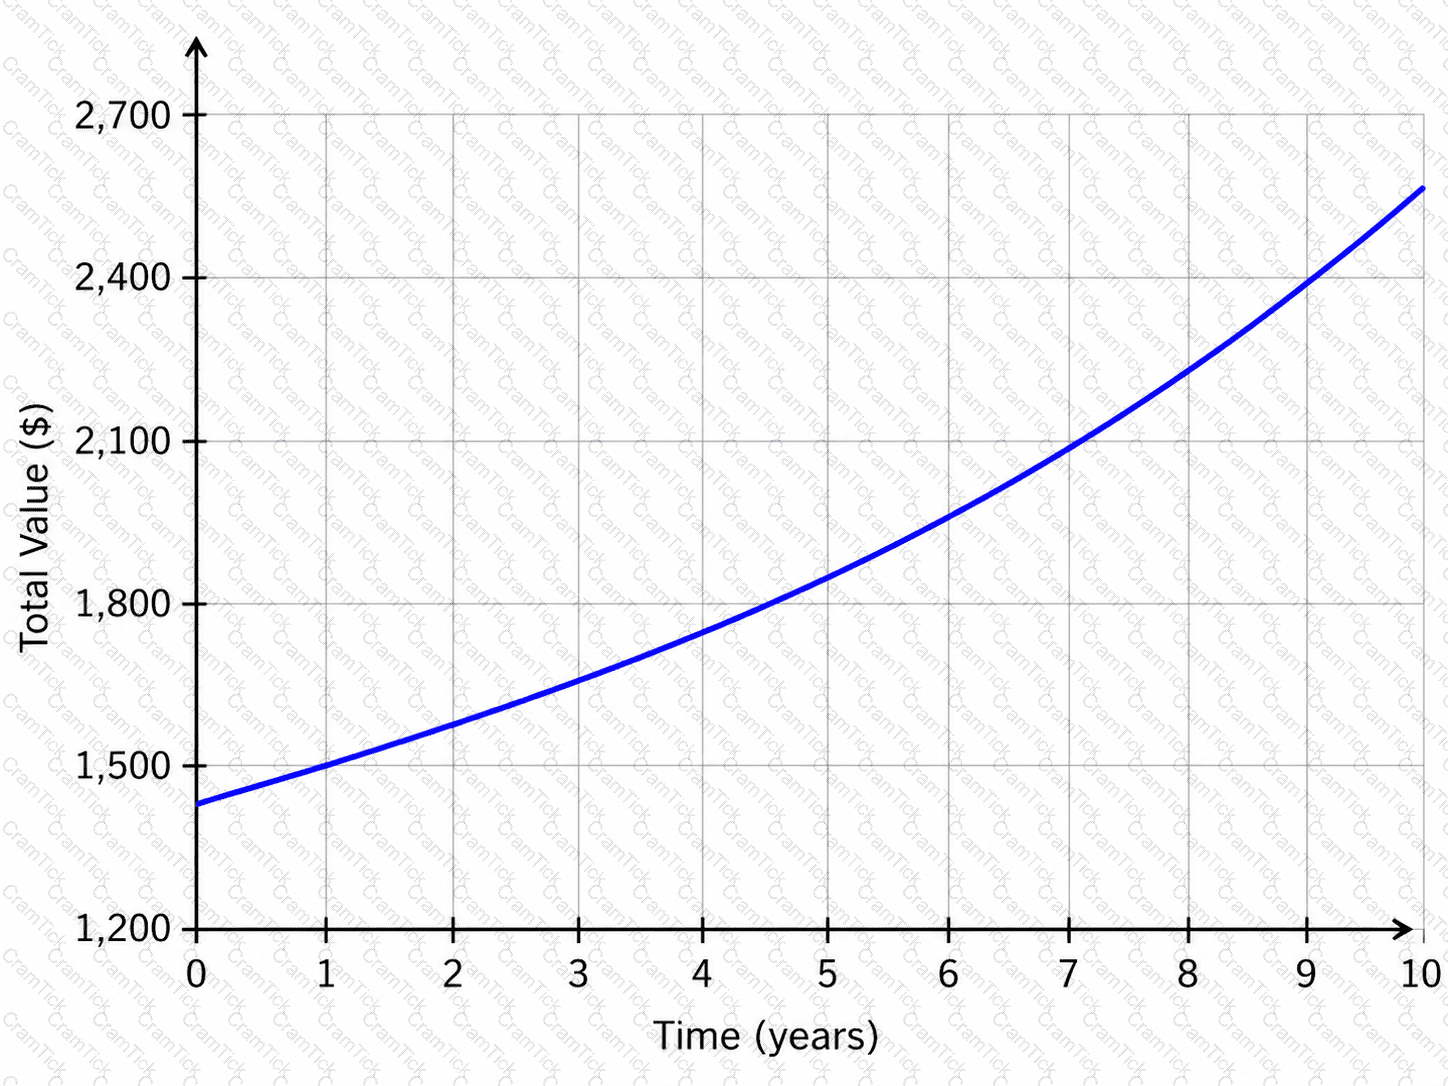
What is the total value when x=4?
As regulations change, the number of licensed sellers of a product decreases. The graph models the change in the number of licensed sellers over time.
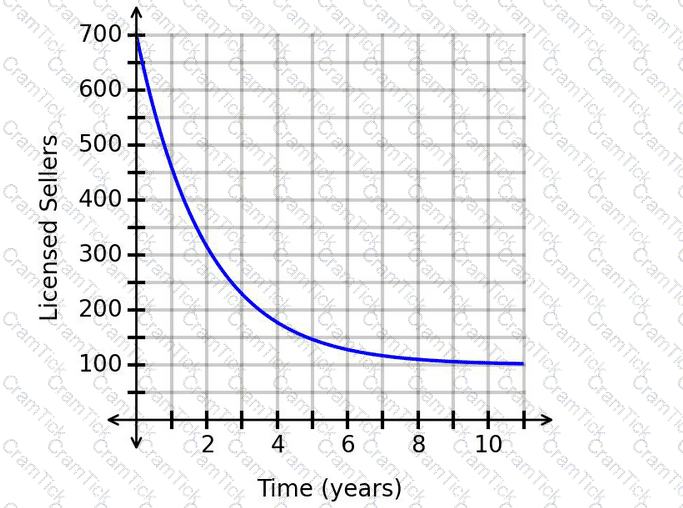
What does the horizontal asymptote mean?
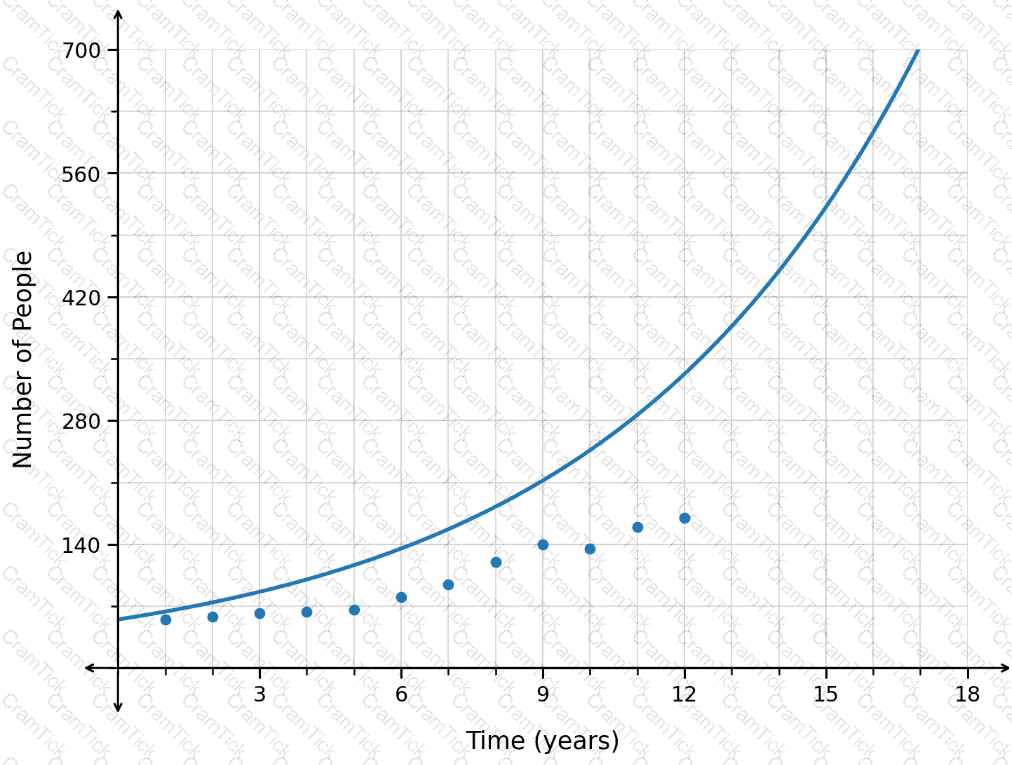
The data in the scatterplot represents the number of monthly train crossings at a particular intersection over time.
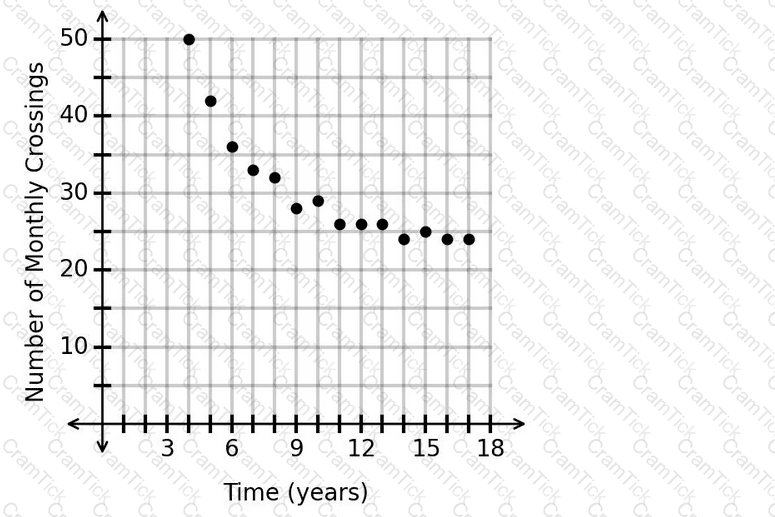
Which type of function should be used to model the data?
The number of members of a religious organization can be modeled using the logistic function f(x), where xrepresents the number of years since the organization was started and f(x)represents the number of members. The graph of f(x)is shown.
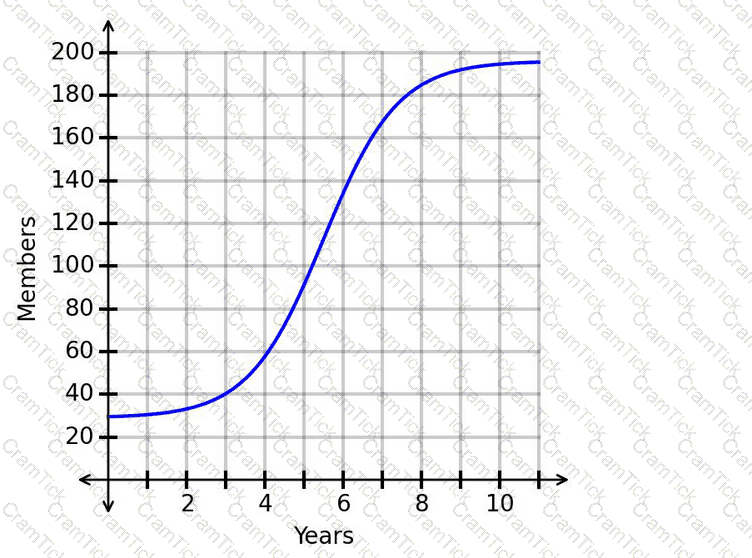
What is one range of values for which the graph is concave down?
The spread of two viruses within a single population is modeled using the functions in the graph.
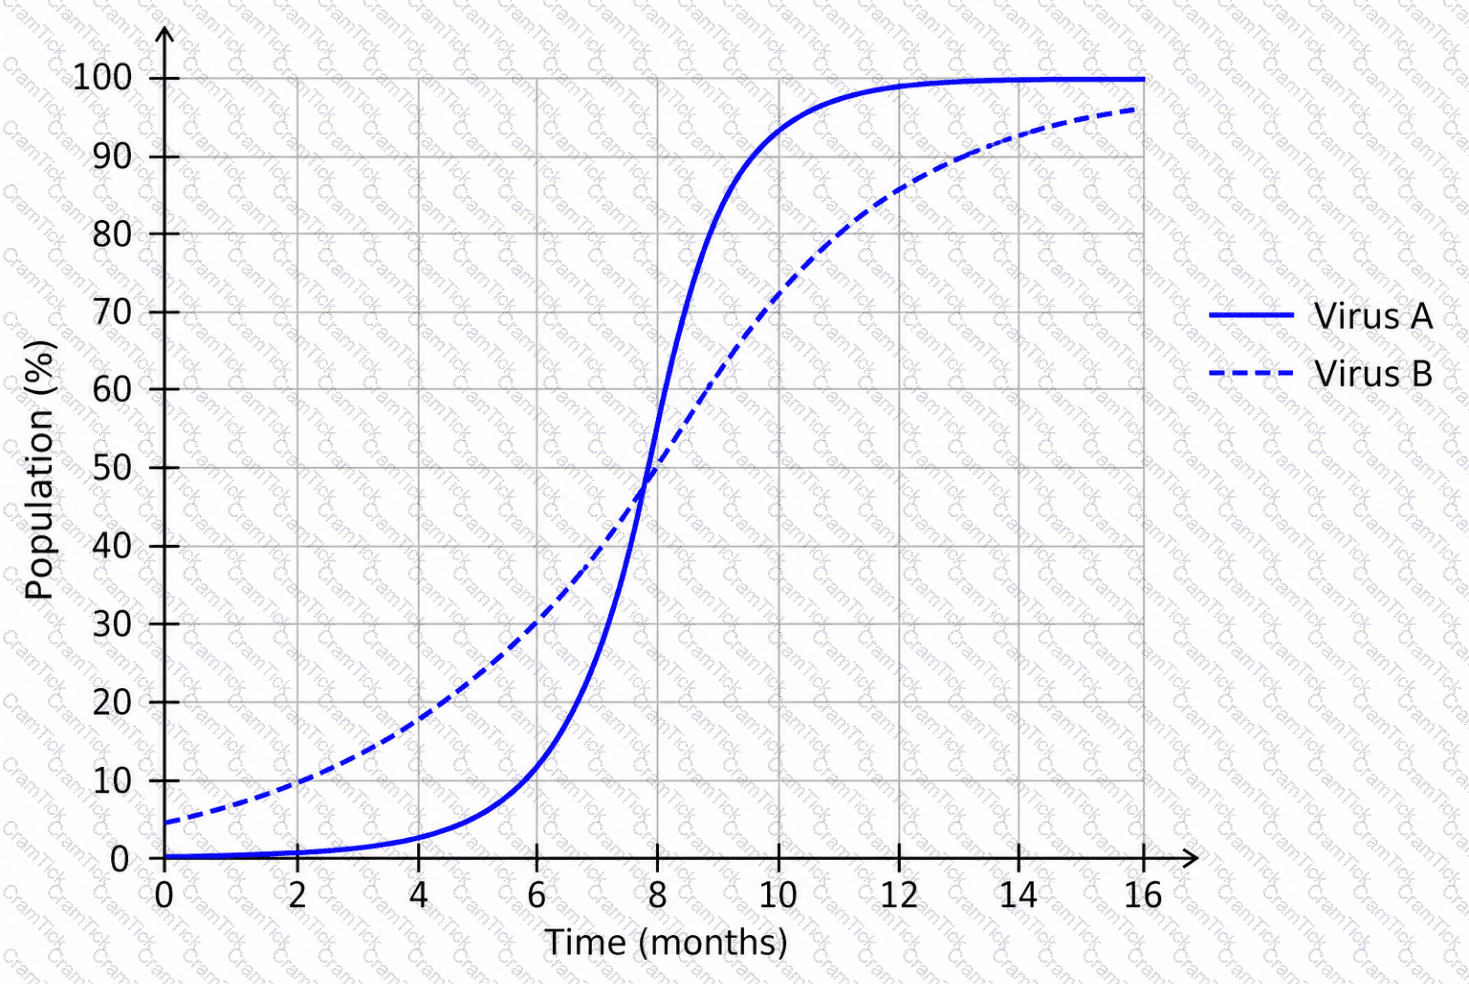
What is a correct conclusion based on the graph?
The given function represents the price of a commodity, p, in dollars, based on the number of months, m, since the beginning of 2020.
p(m)=5m+5
What is the average rate of change of the price over the interval m=1to m=10?
The graph shows the daily practice duration for a musician, where the number of days since the beginning of the month is along the horizontal axis and the number of minutes practiced per day is along the vertical axis.
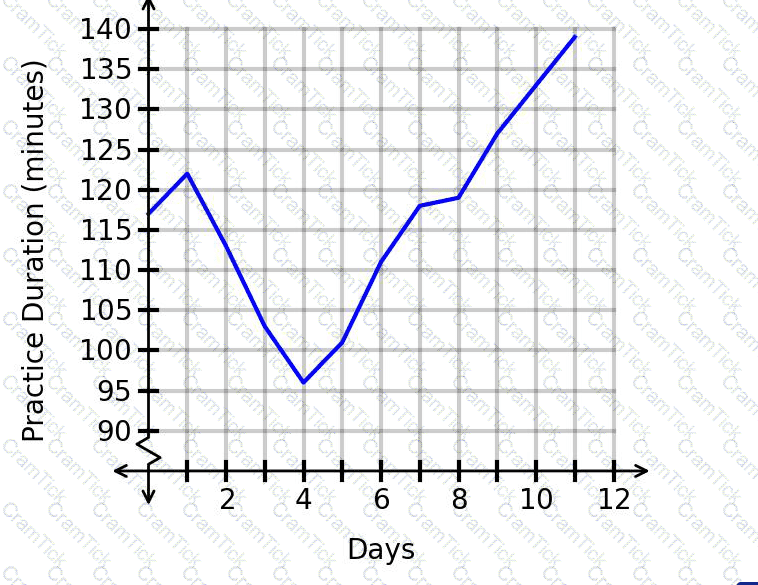
What was the practice duration for day 9, based on the graph?
The graph shows the progress of a manufacturing team, modeling the number of widgets the team is able to produce each day since the team was formed.
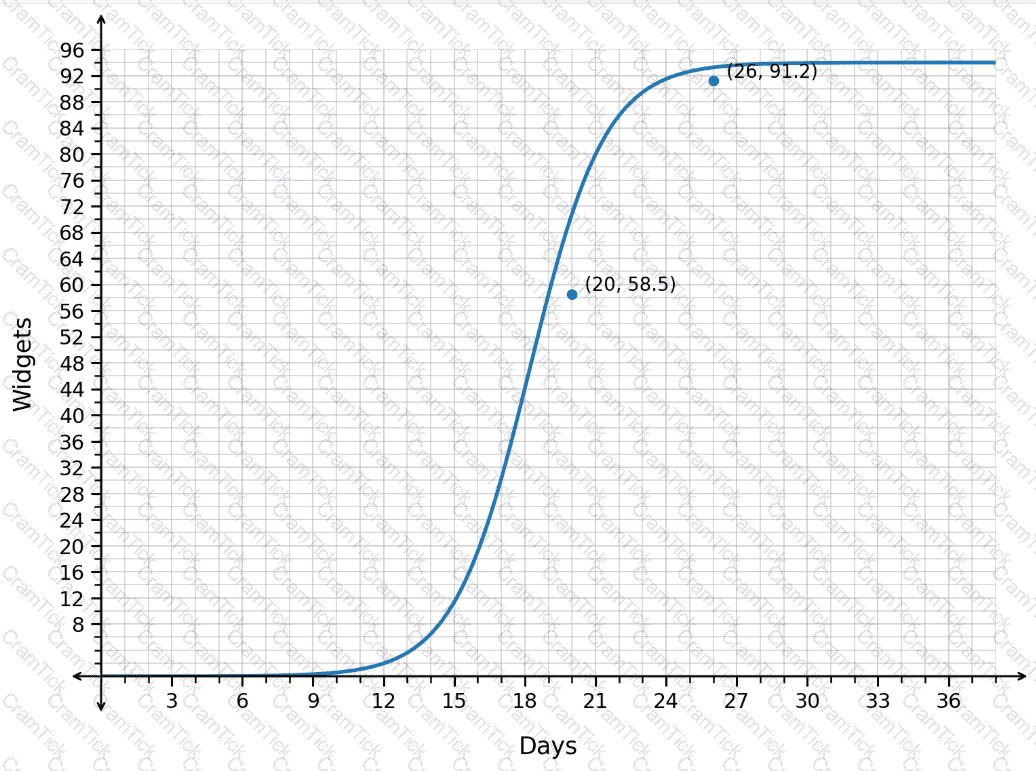
How should the average rate of change from day 20 to day 26 be interpreted?


TESTED 08 Jul 2026