What are two outcomes when you drag a continuous date value to the Rows shelf? Choose two,
You have the following string value: Sales Data.
Which calculated field produces an output of Sales?
What is the one critical difference between normal calculated fields, and the calculated fields created after Data blending?
Using the CoffeeChain table, create a crosstab showing the Total Expenses per State and add Column Grand Totals to the view. Now group the states of New York, California and Washington. What percent of the total sales does this group contribute?
What are three benefits of using an extract as compared to a live connection to a data source? Choose three.
A _____________ action is a hyperlink that points to a web page, file, or other web-based resource outside of Tableau.
Download the Dataset from: https://drive.google.com/file/d/12AYHfiPWkwBmvH0zbumOURgUX6Az00Rw/view?usp=sharing
Using the Time Series Table, create a line chart to show Sales over time. Which Month and Year witnessed the lowest Sales?
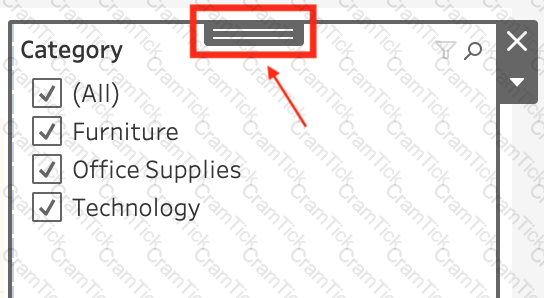
If you have a dashboard and are displaying its filter, how can you rearrange it?
True or False: Physical tables remain distinct (normalized), not merged in the data source whereas logical tables are merged into a single, flat table.
Which statement accurately describes an extract when the Physical Tables option is selected?
What are two benefits of using a live connection to a data source as compared to an extract? Choose two.
Which of the following would you use to connect to multiple tables in a single data source at once?
What two methods can you use to change the font of a worksheet title? Choose two.
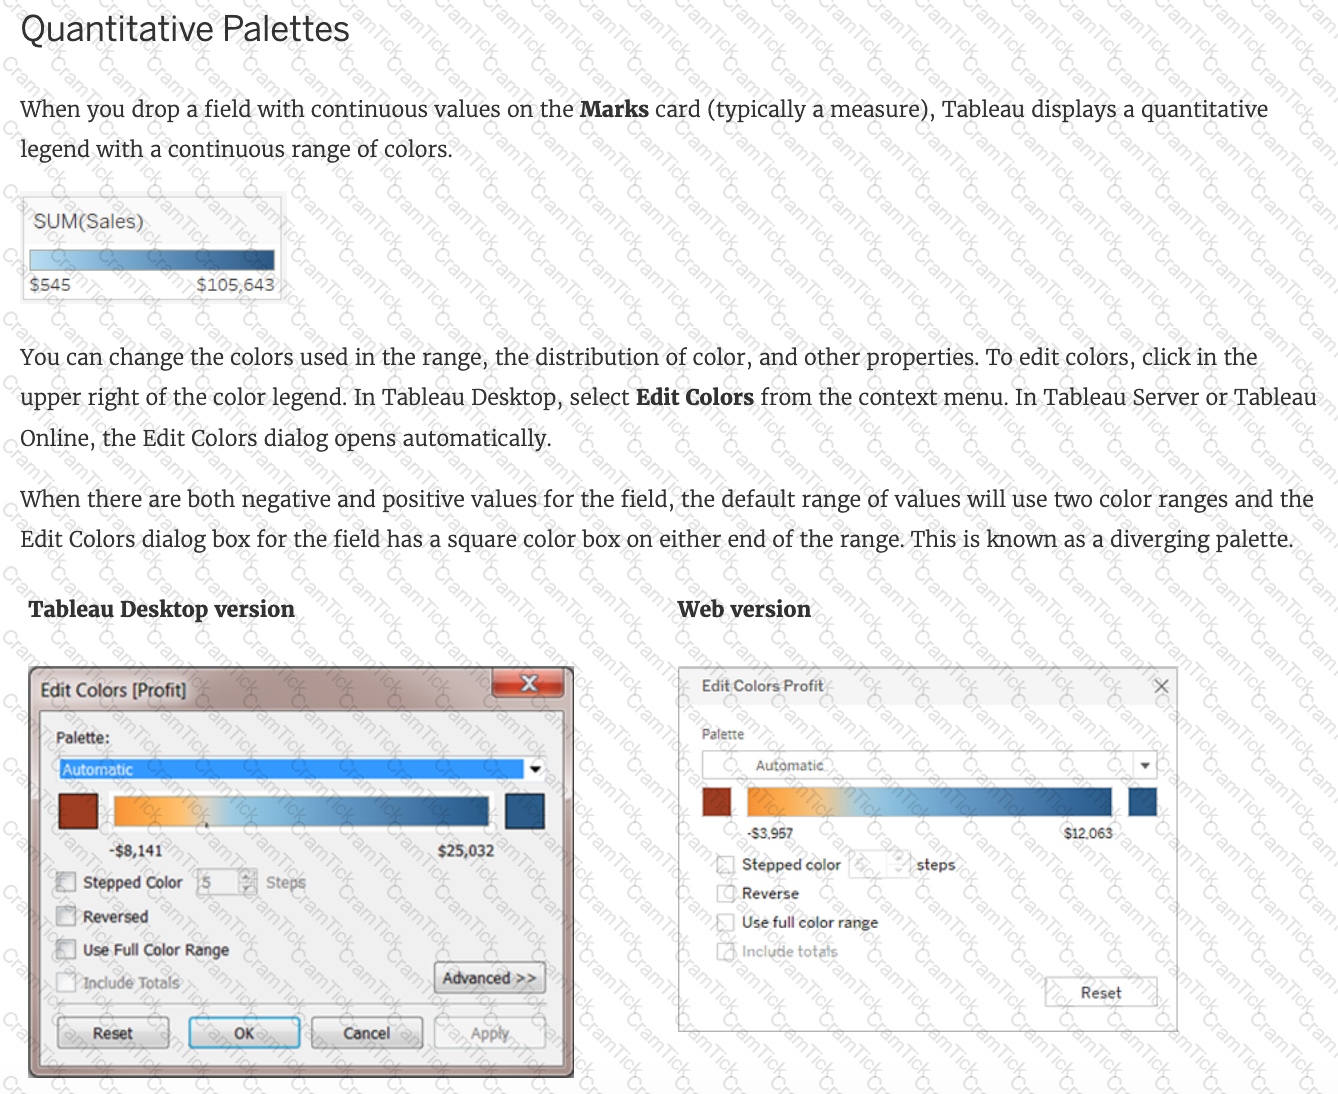
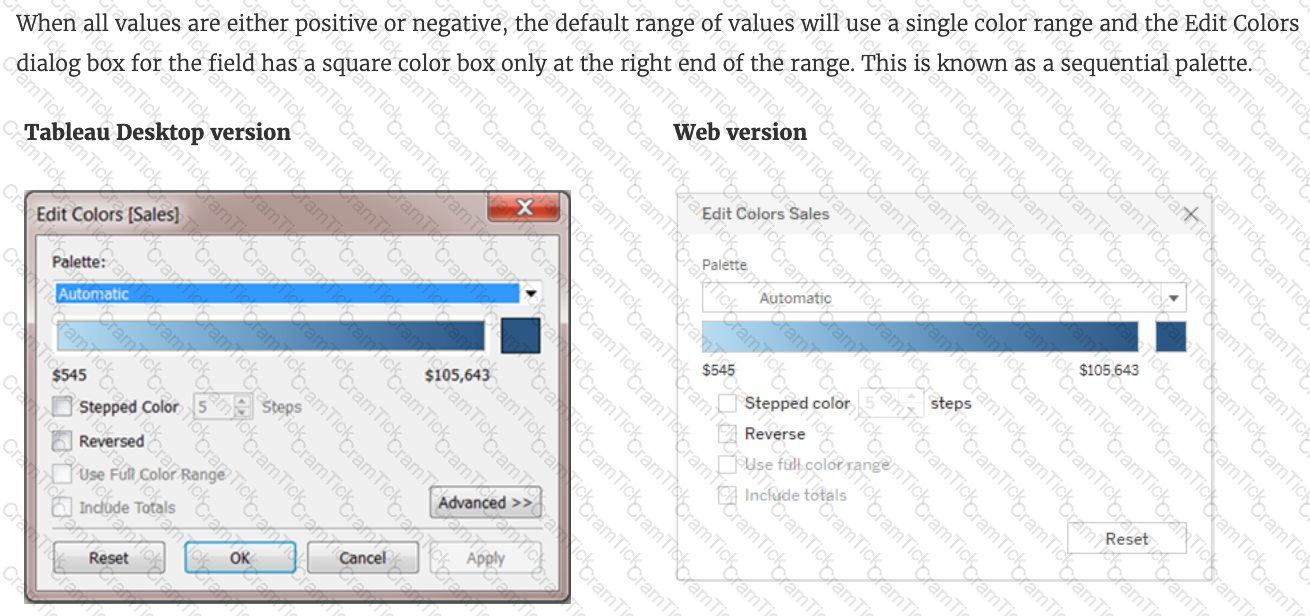
You need to invert the color intensity of a quantitative range. Which option should you use?
True or False: Enabling any other type of sort (Field, alphabetic, or Nested) clears the manual sort we create.
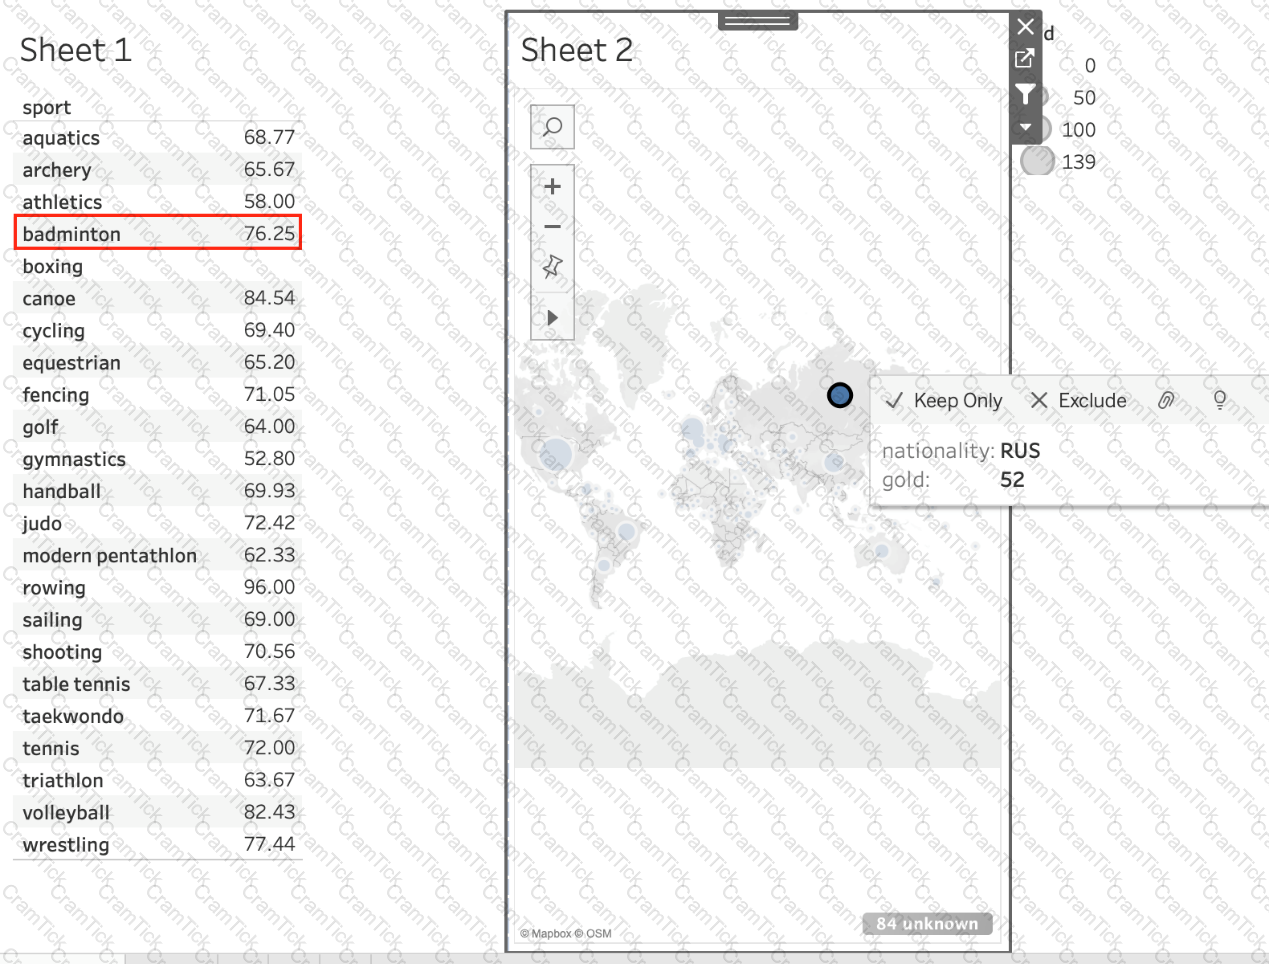
Using the atheletes table:
i) Create a sheet with a crosstab showing the Average weight for each sport (Sheet 1)
ii) Create a sheet with a Map showing the Total number of gold medals per Country. Use size as a Mark. (Sheet 2)
Now, Create a Dashboard containing both these sheets, and Use Sheet 2 as a Filter for Sheet 1. What was the average weight for Badminton in Russia?
(Ignore any nulls / unknowns)
Question 30: Skipped
Using the CoffeeChain table, create a scatter plot of Profit (x-axis) vs Sales (y-axis) broken down by State. Add a Linear trend line to the view. What is its R-squared value?
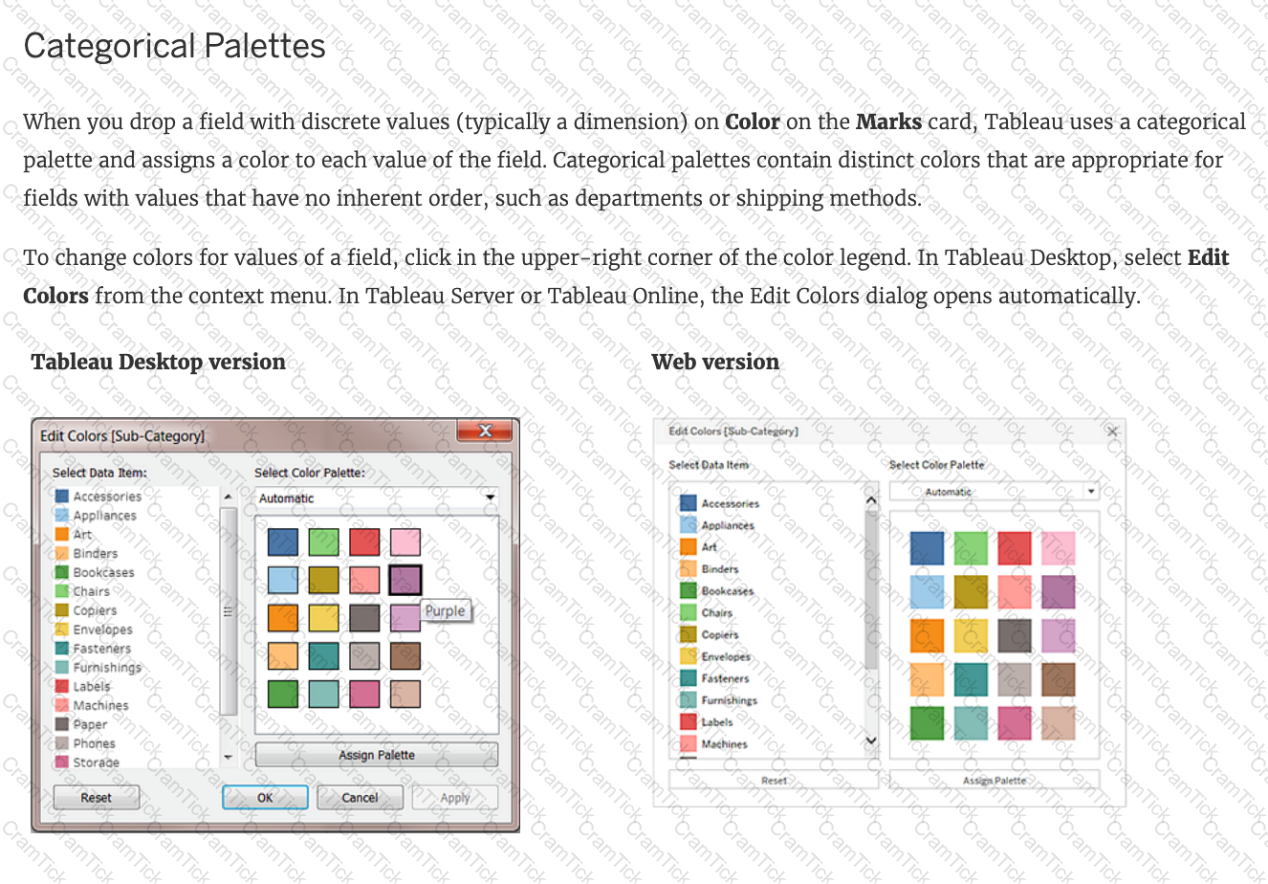
Dragging a ______________ to colour creates distinct colours for each item whereas dragging a ______________ to colour creates a gradient
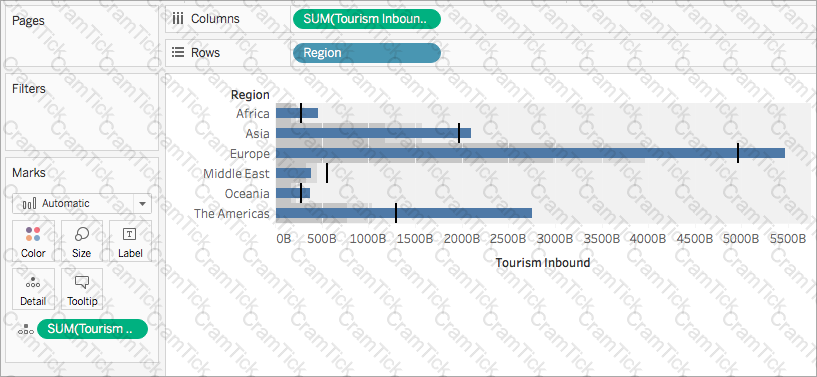
You have the following visualization.
Which set type is created when you select the Create Set option?
True or False: We can disaggregate the data, to see all of the marks in the view at the most detailed level of granularity
Which two options can you use to change the device layout of a dashboard? Choose two.
Which of the following URL prefixes are permitted when creating a URL Action in Tableau?
What is the minimum amount of RAM recommended for any production use of Tableau Server?
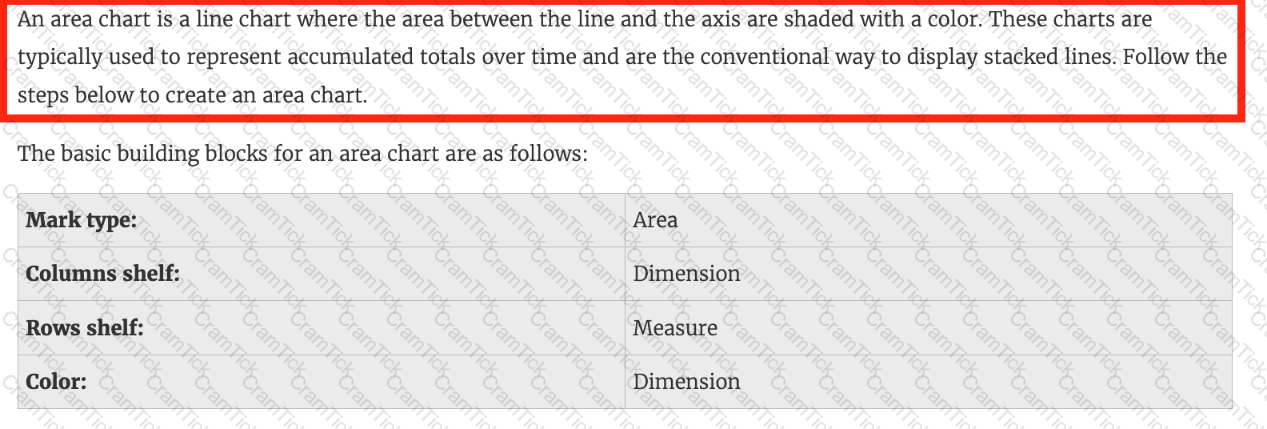
_____________ charts are typically used to represent accumulated totals over time and are the conventional way to display stacked lines.
Which action describes the process for changing a measure so that it automatically aggregates an average instead of a sum?
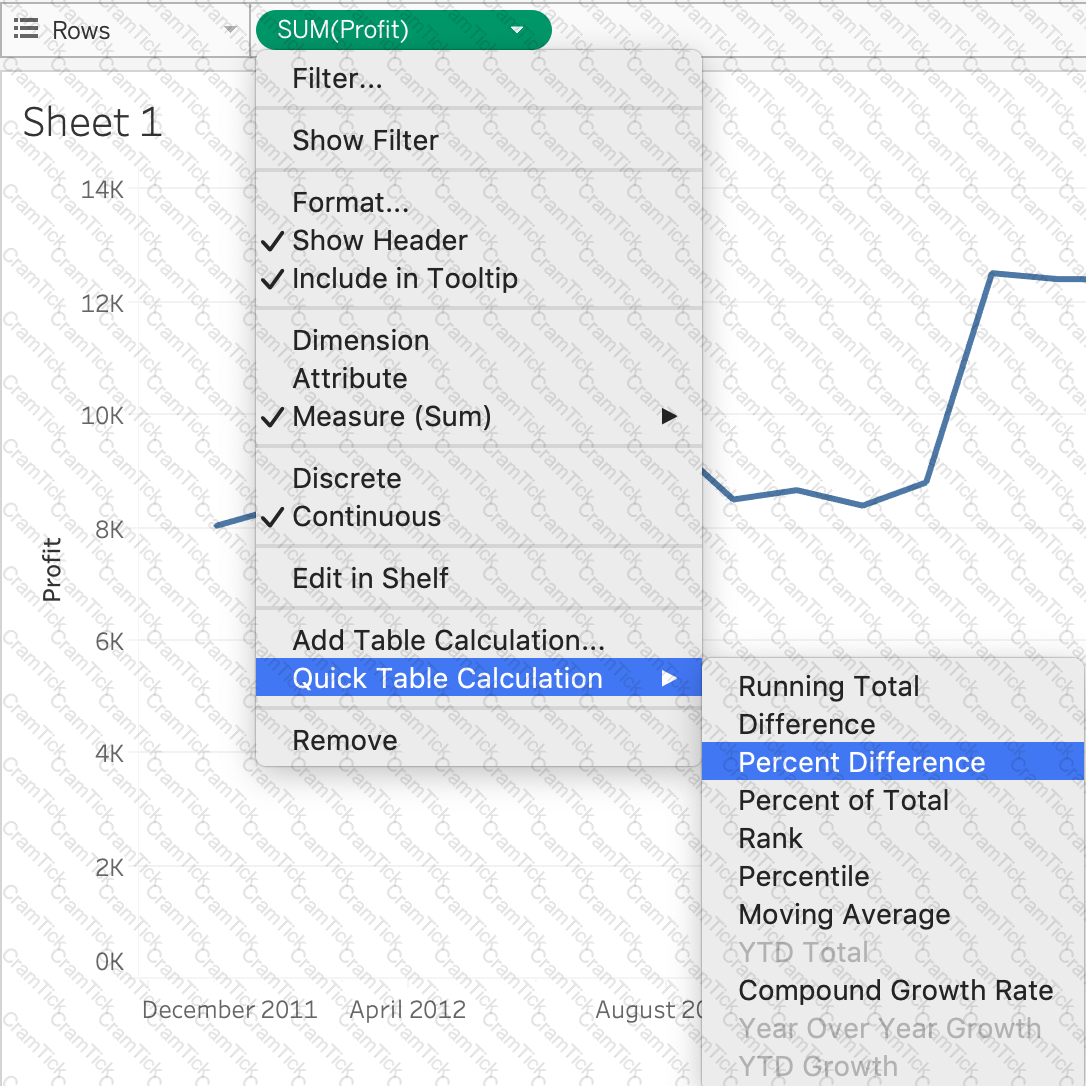
Using the CoffeeChain table, create a chart to see the monthly Percent difference change in Profit, from the beginning of 2012 to the end of 2013. How many months saw a Negative percent difference in Profit?
You have a continuous numeric measure named Sales.
Which chart type is created when you double-click the Sales measure?
True or False: We get different colour pallete options if we drop a discrete field on "Color" in the marks card compared to if we drop a continous field on Color.
You have cleaned a data source properly, created some calculated fields and renamed some columns. You want to save these changes for future use cases. Which of the following would BEST satisfy this requirement?
Which type of date filter can you use to choose a range of dates based on TODAY ()?
_________________ is useful when you need to change how the data source is configured on a sheet-by-sheet basis, and when you want to combine databases that don’t allow relationships or joins
Our use case states that we need to create a set showing the Bottom 10 products by Profit in each Region. Which of the following filter types should you apply on Region?
Which of the following represent a valid method to create a Bullet Graph with the LEAST number of fields possible?
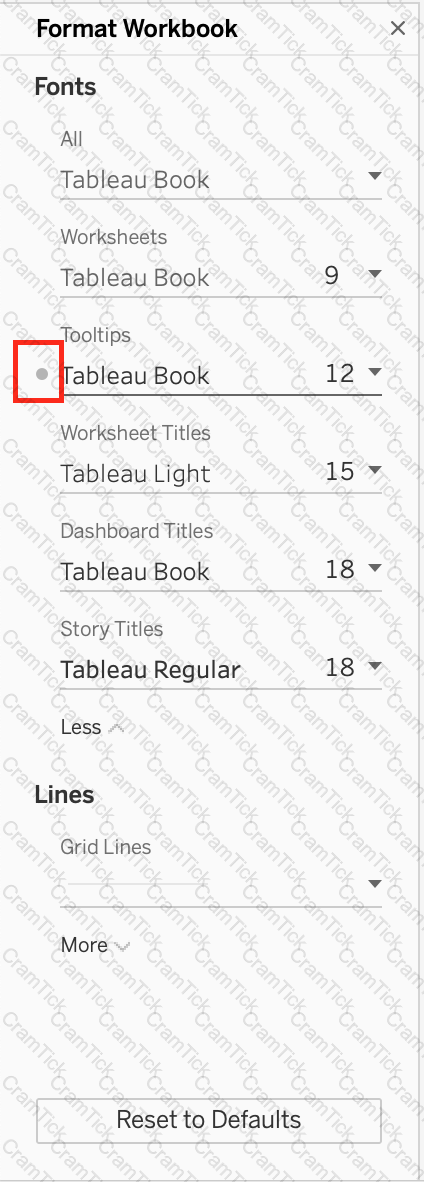
Which of the following describes the best way to change the formatting at a workbook level?
______________ refers to the level of detail for a piece of data, wherever you are looking.
You can create _______________ for members in a dimension so that their labels appear differently in the view.
Using the Time Series table, create a chart that shows the percent difference in Average Inventory on Hand for each Assortment by year and quarter.
How many quarters did the Electronics Assortment show a negative percent difference in the Average Inventory On Hand?
You need to uniformly change the size for all marks in a view.
What should you do?
Question 45: Skipped
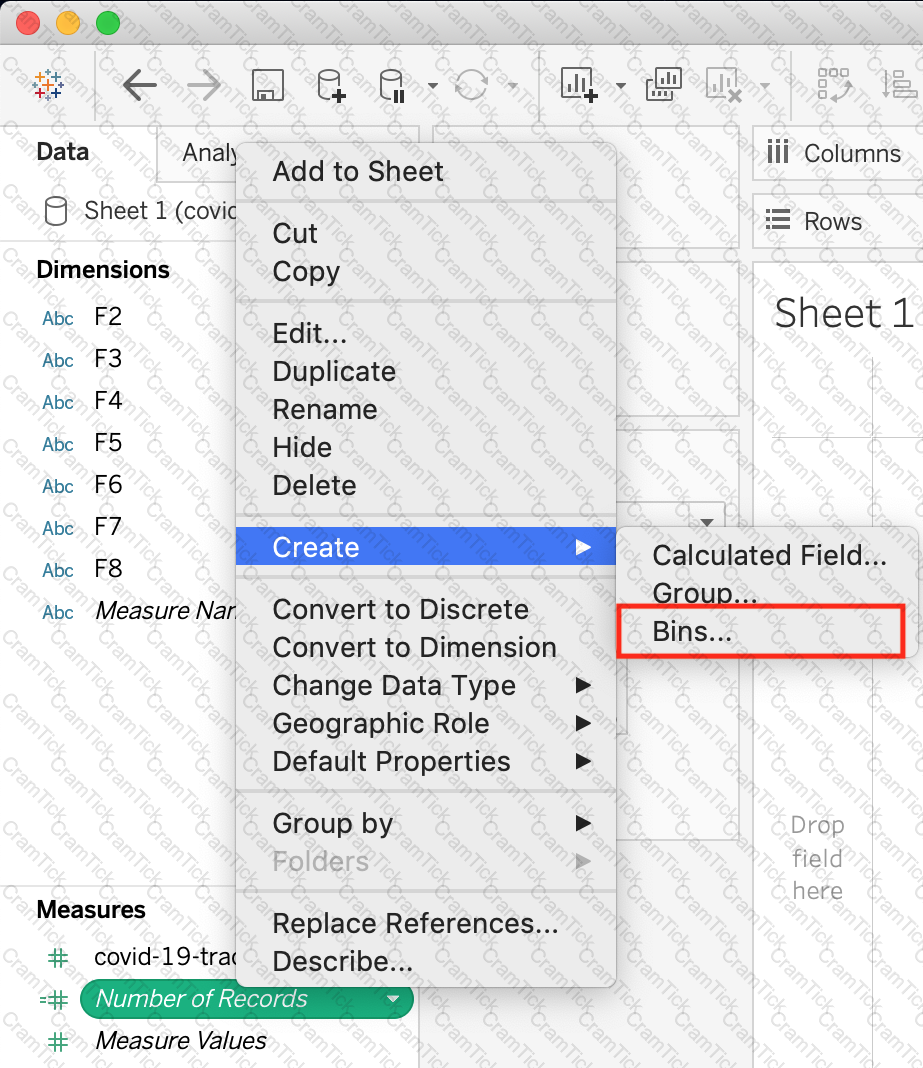
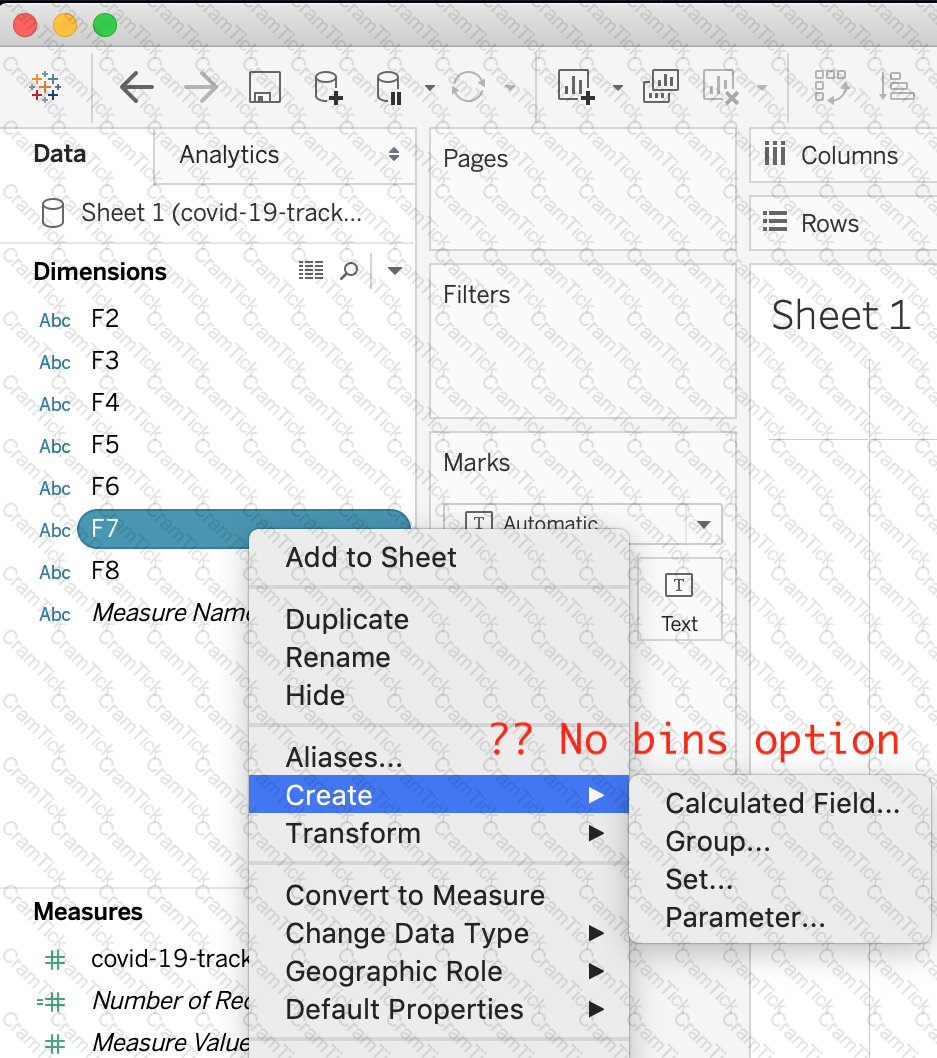
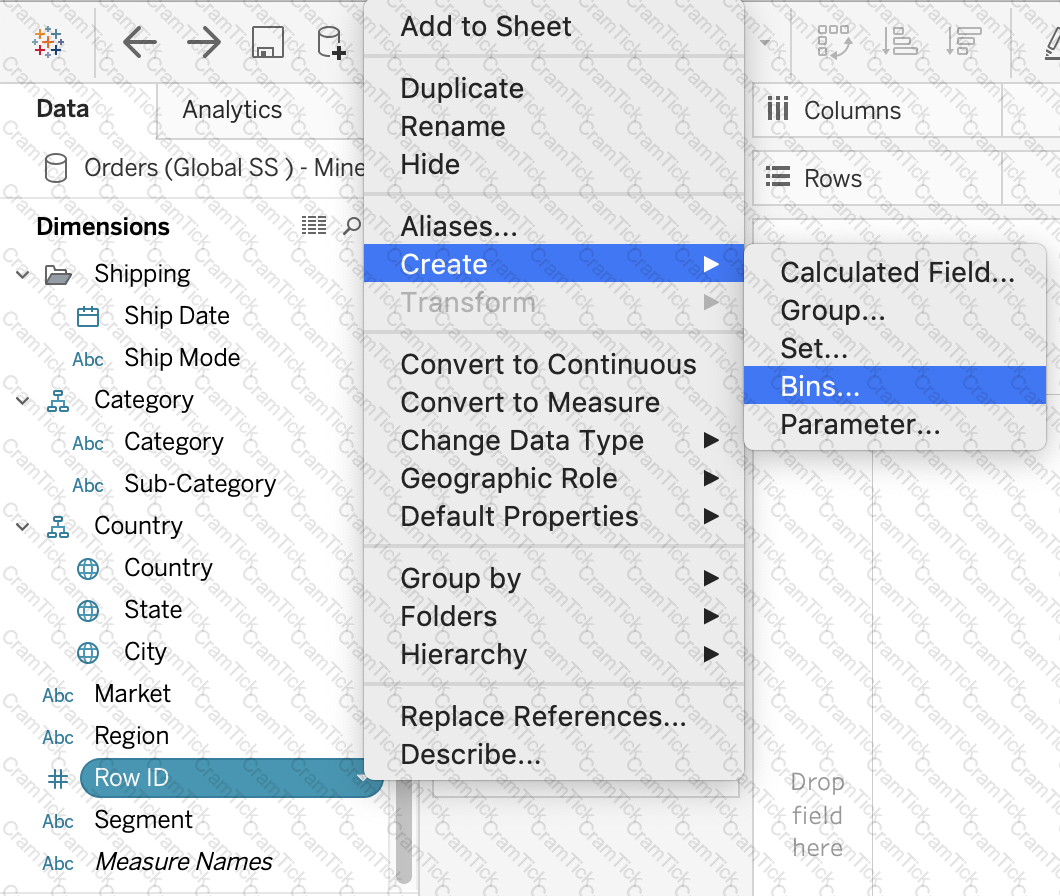
You have just created a histogram and now want to be able to change the size of bins dynamically. Using which of the following will easily satisfy your requirement?
In which of the following scenarios would having a live connection be more beneficial than using an extract?
Given a map, which of the following fields can be placed in Size,Shape,Detail,Color
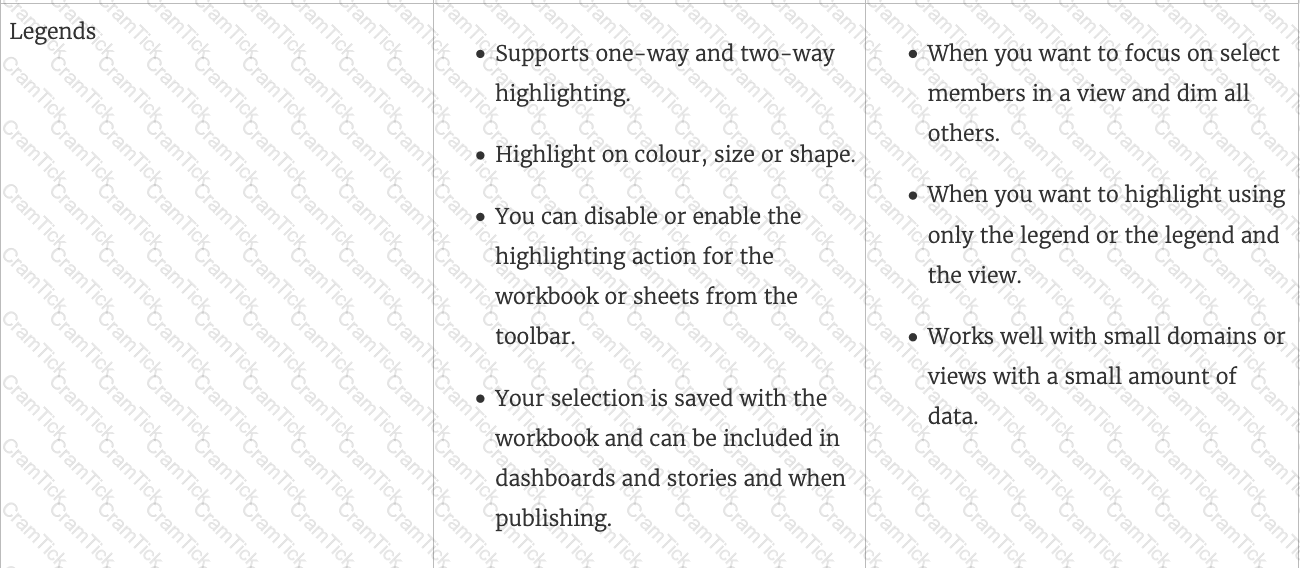
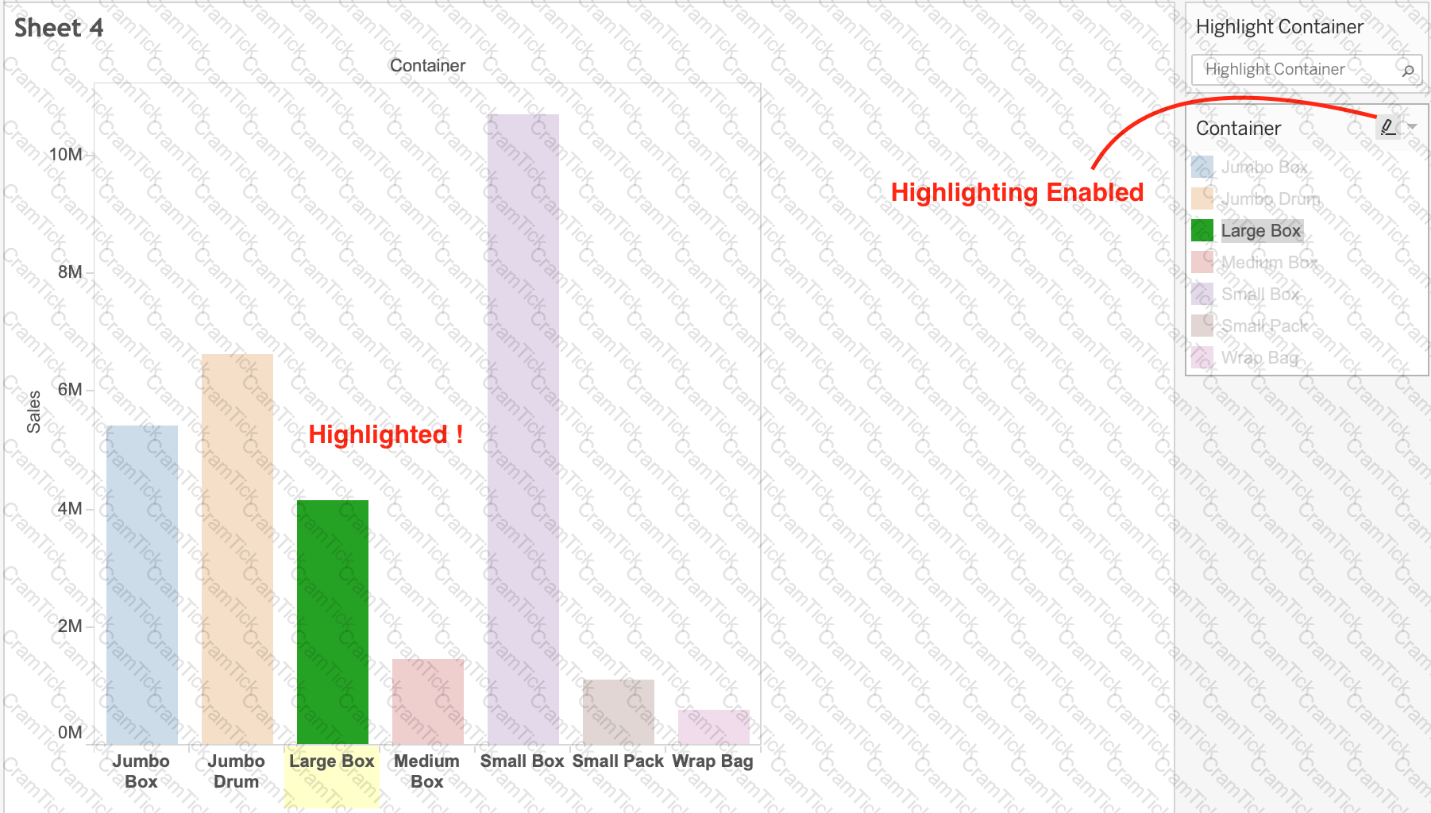
True or False: The Highlighting action can be disabled for the entire workbook.
Yes or No: The number of marks will increase when you increase the number of Dimensions in a view
Using the Time Series Table, create a Line chart showing the Monthly Year over Year Growth for the Sales, broken down by Assortment. For the Electronics assortment, which Month had the most NEGATIVE value of Year over Year Growth?
Which of the following are the options to export the data used to build the view / visualisations?
________________ is hosted by Tableau to share our visualisations publically with the world.
When you connect to a new data source, all worksheets that previously referred to the original data source now refer to the new data source. If the new data source does not have the same field names as the original workbook, the fields are marked with an exclamation point
. Which feature helps us fix this issue?
You have a dashboard that shows car rental statistics by city, including a field named Car Dropoff City in the view. A URL action in the dashboard uses https://en.wikipedia.org/wiki/
When you click Salt Lake City in the view, to where will the URL action direct you?
The default path for all supporting files, data sources, icons, logs etc is in ______________________
Tableau Desktop Specialist | TDS-C01 Questions Answers | TDS-C01 Test Prep | TDS-C01 Online Exam | TDS-C01 Practice Test | TDS-C01 PDF | TDS-C01 Test Questions | TDS-C01 Study Material | TDS-C01 Exam Preparation | TDS-C01 Valid Dumps | TDS-C01 Real Questions | Tableau Desktop Specialist TDS-C01 Exam Questions

TESTED 06 Jul 2026
 Chart, bar chart
Description automatically generated
Chart, bar chart
Description automatically generated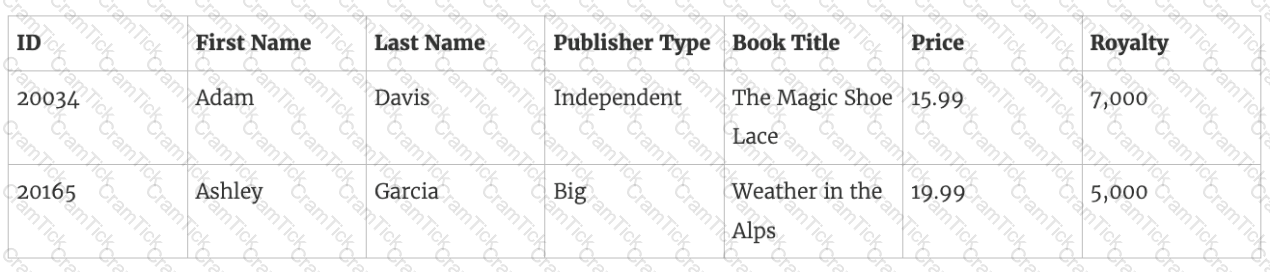

 Graphical user interface, application
Description automatically generated
Graphical user interface, application
Description automatically generated