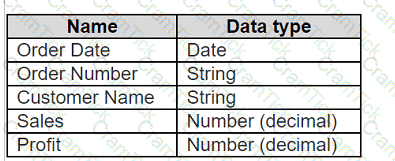
You have the following two tables.
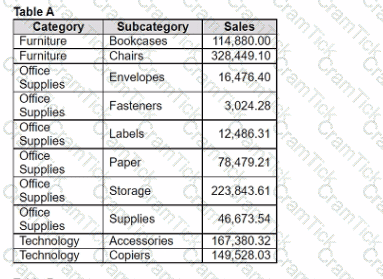
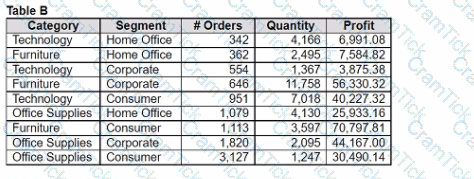
Table A is the primary table.
Which type of join is established when a blend is created by using the join key of Category?
A Data Analyst has a website that displays data in a table format.
The analyst wants to connect to the data of the website by using the least amount of effort.
What should the analyst use to connect to the data?
A Data Analyst has the following chart that shows the cumulative volume of sales from various dates.
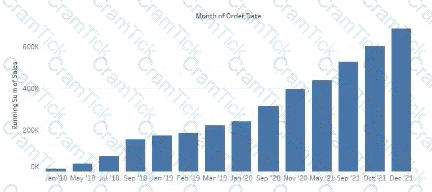
The analyst wants the months to appear as shown in the following chart.
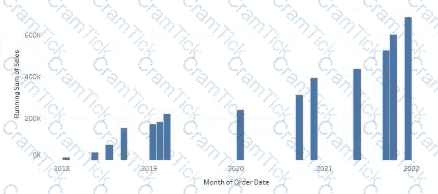
What should the analyst do?
Below are some of the values in the Order_ID field:
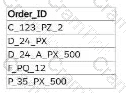
Which calculation should a Data Analyst use to return the two-letter combinations starting with the letter " P " for each of these values?
You have the Mowing two tables that contains data about the books in a library.
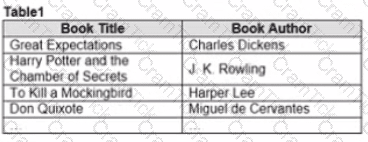
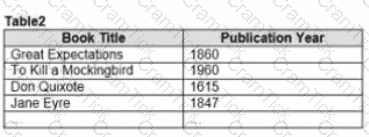
Both tables are incomplete so there are books missing from the tables.
You need to combine the tables. The solution must ensure that all the data is retained
Which type of join should you use?
You have the following dataset that contain null values in the Profits field.
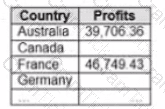
You want the data to appear as shown in the following table.
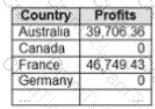
Which two formulas achieve the goal? Choose two.
A Data Analyst would like to receive the draft results of a colleague ' s Tableau Prep flow to start work on a dashboard before it has been published.
What should the analyst do to accomplish this?
When a Data Analyst needs to format workbook settings, which options are available in the Format Workbook panel?
A Data Analyst has the following bar chart.
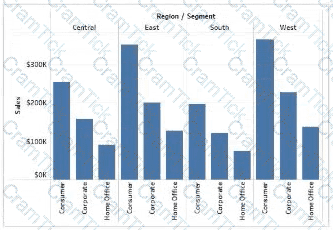
The analyst wants the chart to appear as shown in the following exhibit.
What should the analyst add?
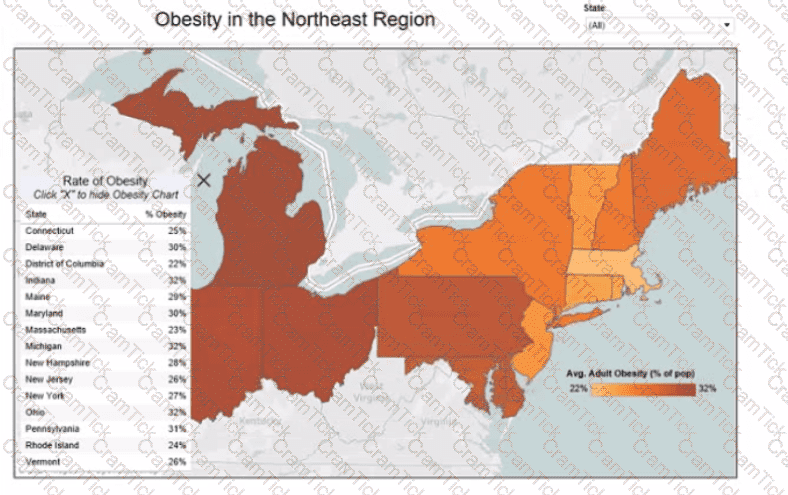
You have the following Map.
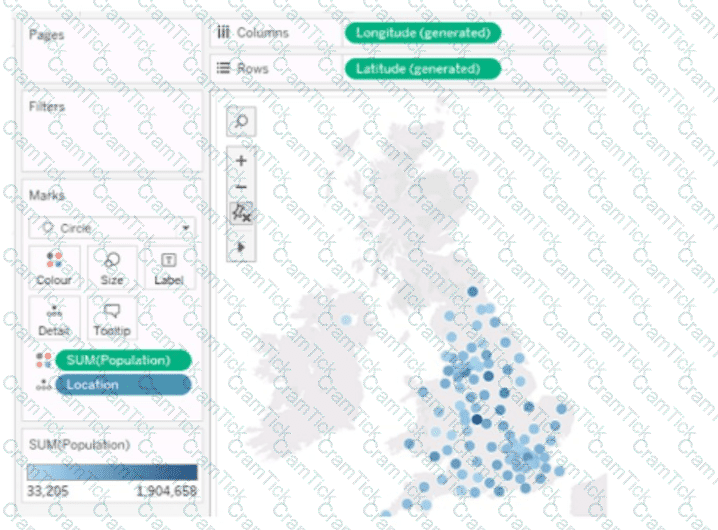
You need the map to appear as shown in the following visualization.
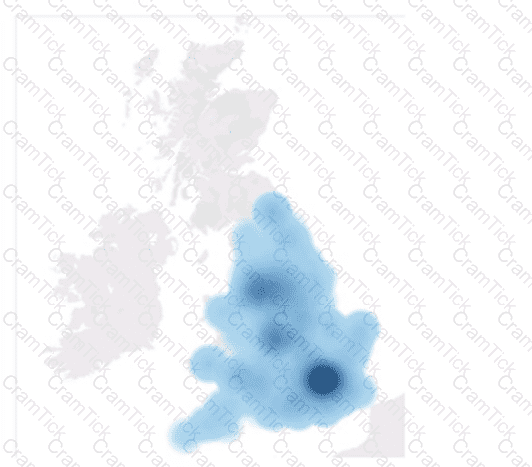
What should you do?
You subscribe to a view that delivers a daily email to your inbox.
You want to make the subscription available to other stakeholders.
What should you do?
A Data Analyst has two tables named EmployeeInfo and DepartmentInfo. EmployeeInfo contains four fields named Full Name, Department ID, Start Date, and Salary. DepartmentInfo contains four fields named Department Name, Size, Department ID, and VP. The analyst wants to combine the tables to meet the following requirements:
EmployeeInfo is the first table that is dragged to the canvas,
The records must contain the Full Name, and the Department Name, Size, and VP fields if available,
Not all records have an exact match.
Which type of join should the analyst use?
A Data Analyst has the following two tables named Orders and Returns.
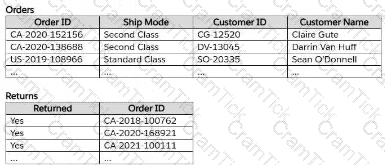
The analyst needs to get the Customer ID and Customer Name for only the orders that were returned. Orders will be the leading table.
Which type of join should the analyst perform in Tableau Prep?
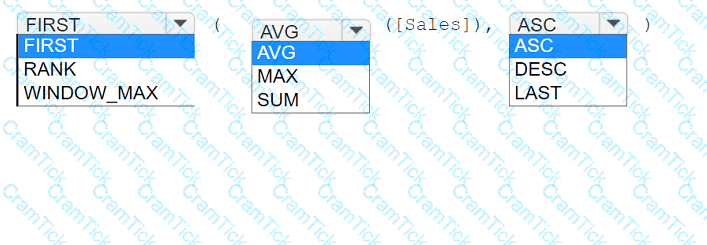
You have a data source that contains the following columns.
You want to sort customers based on the most expensive orders.
How should you complete the formula? (Use the dropdowns in the Answer Area to select the correct options to complete the formula.)
A Data Analyst creates a parameter named Choose Region that contains values from a field named Region.
The analyst wants users to be able to use the Choose Region parameter to interact with a chart by toggling between different regions.
What should the analyst do next?
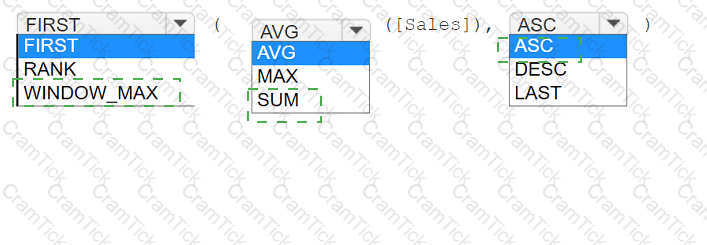
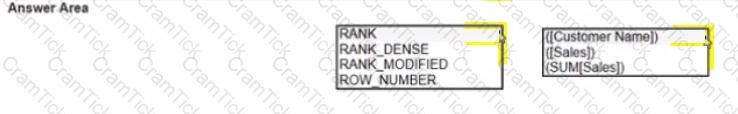
You have the following dataset.
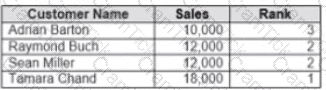
Yon need to calculate the ranking shown in the Rank field.
How should you complete the formula? (Use the dropdowns in the Answer Area to select the correct options to complete the formula ?
You have a database that includes field named sales, City and Region.
You have the following chart that shows the number of sales made in different cities.
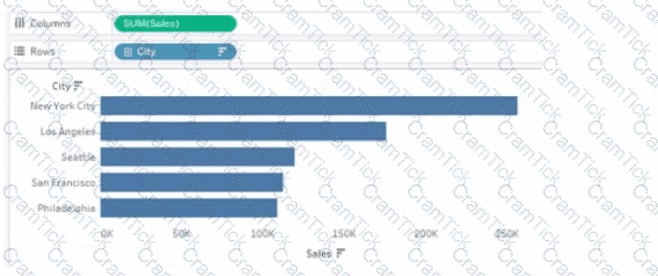
You want to dynamically show the corresponding region when users hover their mouse over any of the bars.
What should you do?
You have the following line chart that shows the average sales by month.
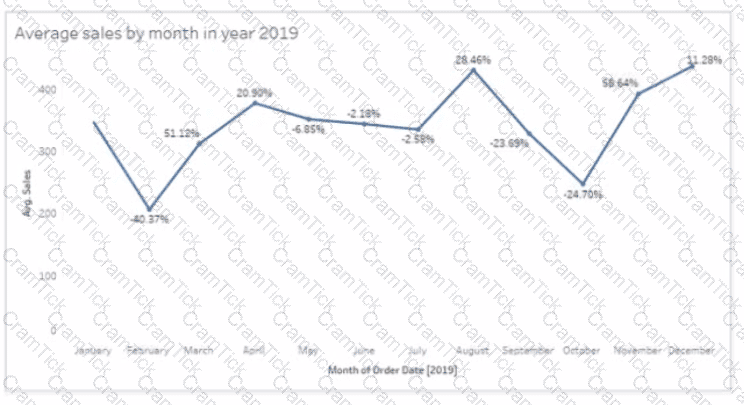
Which month had the biggest increase in swage sales compared to me previous month in 2019?
You have the following data source in tableau Server.
You need to ensure that the data is updated every hour.
What should you select?
You publish a dashboard tut uses an attract. The extract refreshes every Monday at 10:00.
You need to ensure that the extract also refreshes on the last day of the month at 18:00.
What should you do?
You want to connect a Tableau workbook to a dataset in a Microsoft Excel spreadsheet.
What should you do from Tableau Desktop?
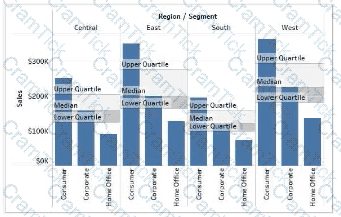
You have the following box plot that shows the distribution of average profits made in every state by region.
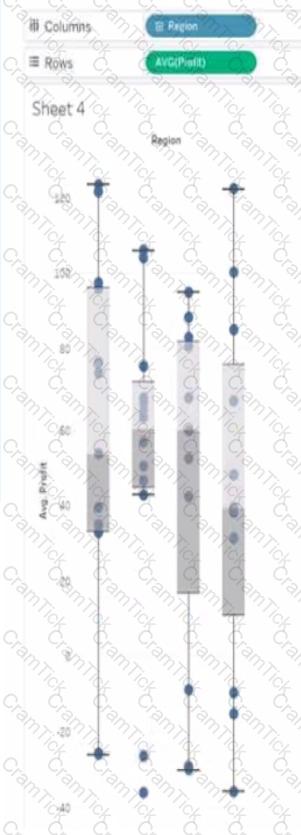
Which region has the smallest distribution of profits?
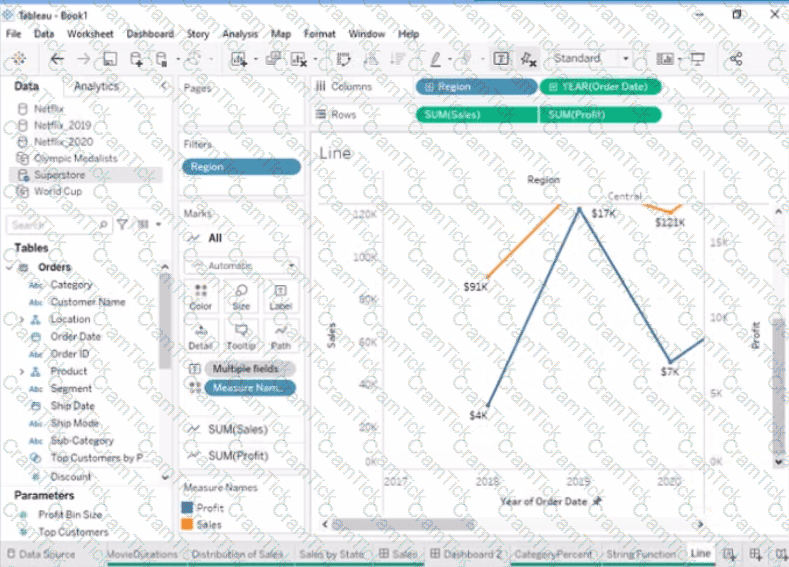
Open the link to Book1 found on the desktop. Open the Line worksheet.
Modify the chart to show only main and max values of both measures in each region.
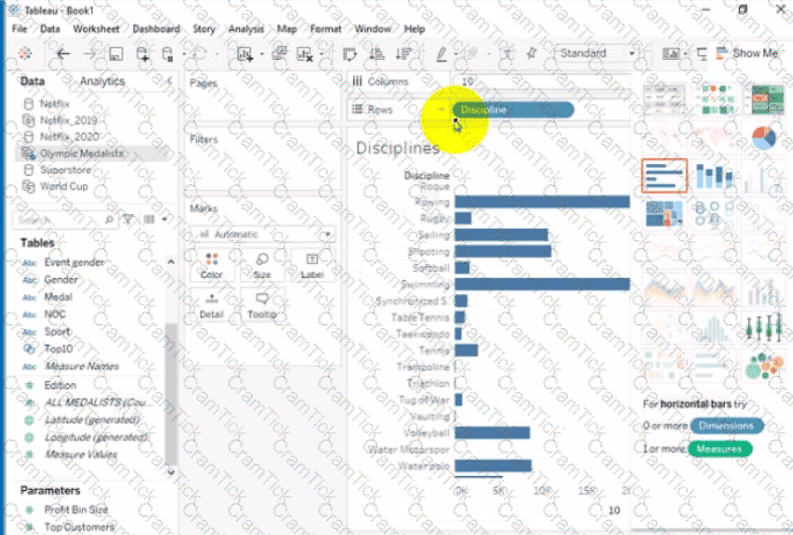
Open the link to Book1 found on the desktop. Open Disciplines worksheet.
Filter the table to show the members of the Top10 set and the members of the Bottom10 set. There should be a total of 20 rows.
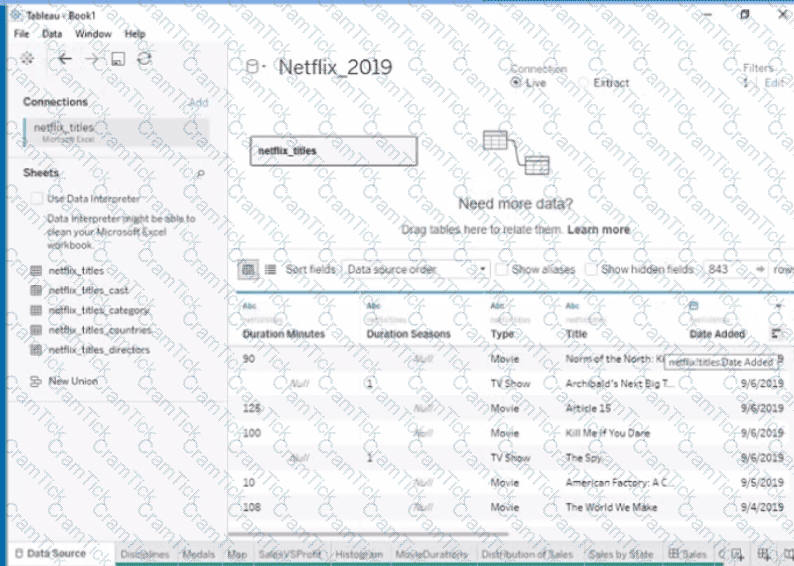
Open the link to Book1 found on the desktop. Open the Movie Durations worksheet.
Replace the existing data source with the Netflix_2019 data source.
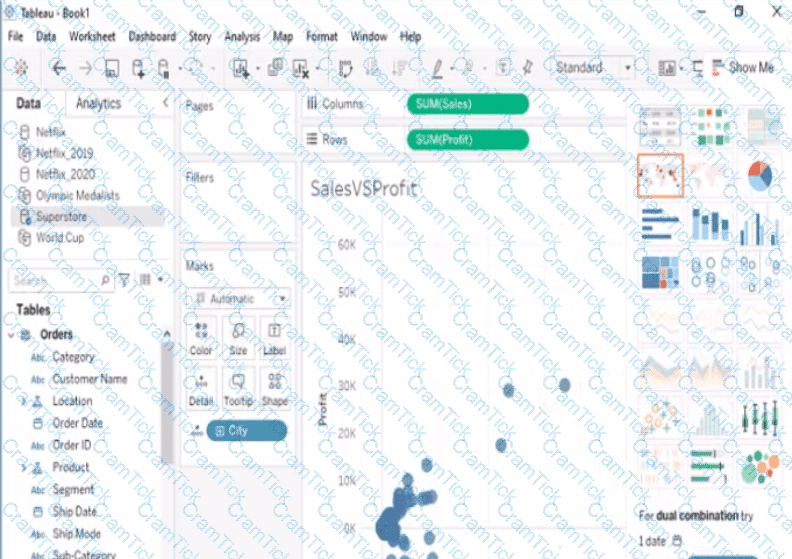
Open the link to Book1 found on the desktop. Open SalesVSProfit worksheet.
Add a distribution band on Profit to show the standard deviation from- 1 to 1.
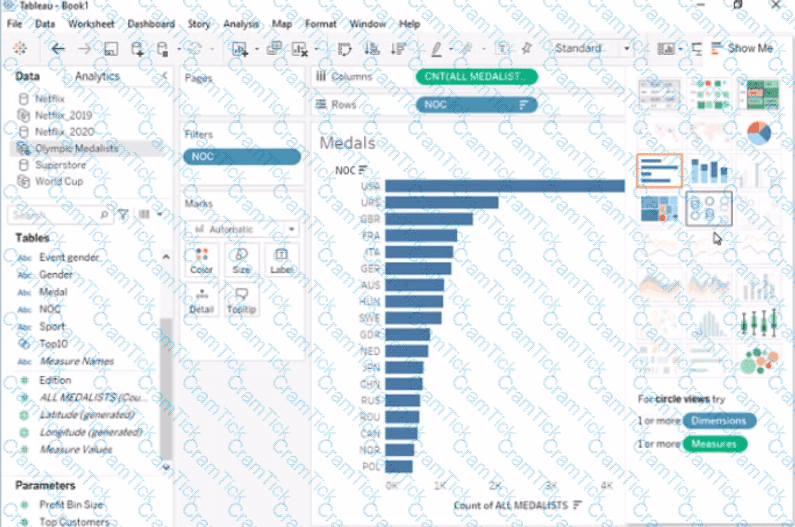
Open the link to Book1 found on the desktop. Open Disciplines worksheet.
Filter the table to show the Top 10 NOC based on the number of medals won.
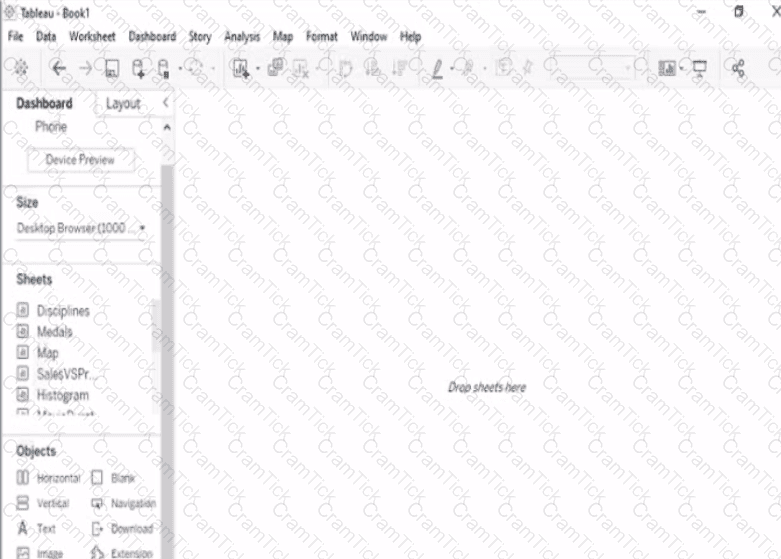
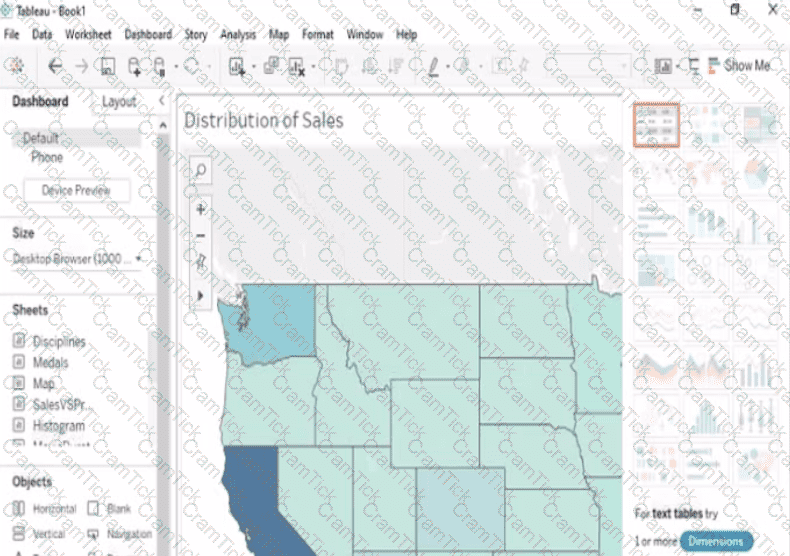
Open the link to Book1 found on the desktop. Open the sales dashboard.
Add the Sales by State sheet in a Show/Hide button to the right side of the dashboard.
Open the link to Book1 found on the desktop. Use the Superstore data source.
Split the Customer Name field into two fields named First Name and Last Name.
Open the link to Book1 found on the desktop. Open the CategoryPercentage worksheet.
Modify the bar chart show the percentage of sales for each Subcategory within every Category. The total percentage for every Category must be 100%.

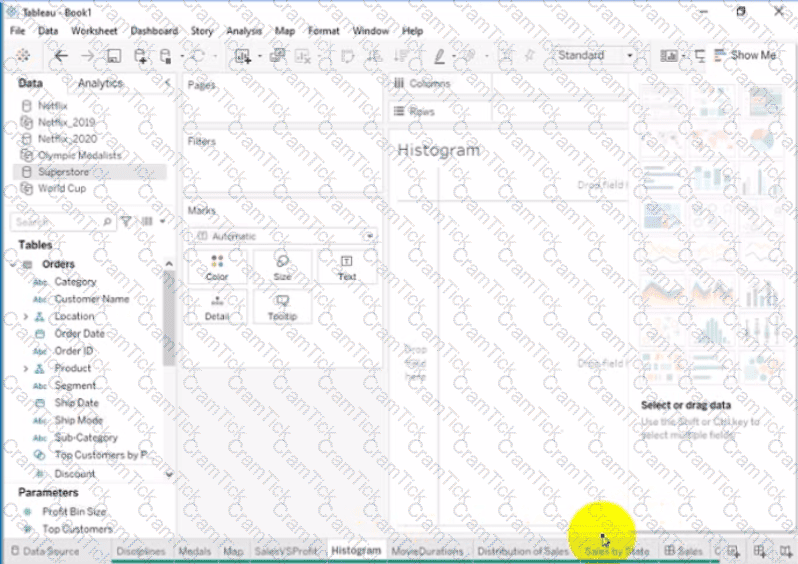
Open the link to Book1 found on the desktop. Open the Histogram worksheet and use the Superstone data source.
Create a histogram on the Quantity field by using bin size of 3.


TESTED 05 Jul 2026