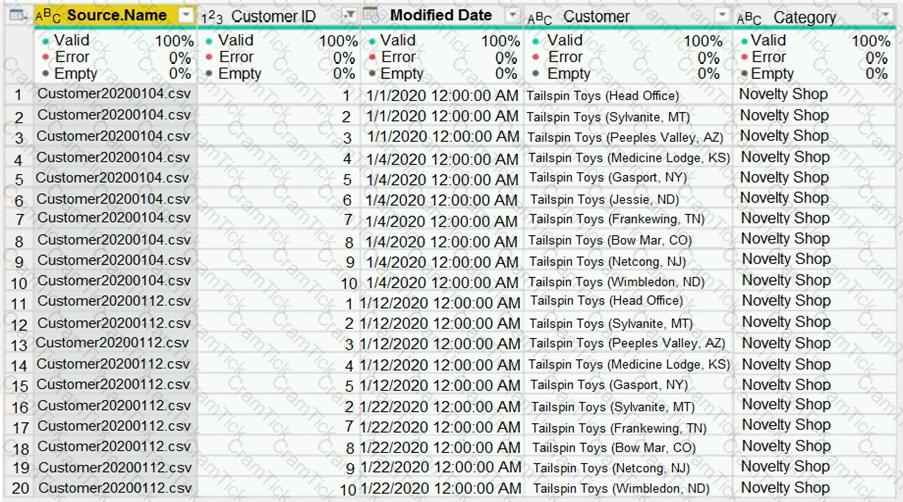
You merge data from Sales.Region, Region_Manager, Sales_Manager, and Manager into a single table named Region. What should you do next to meet the reporting requirements of the executives?
You need to get data from the Microsoft SQL Server tables. What should you use to configure the connection'
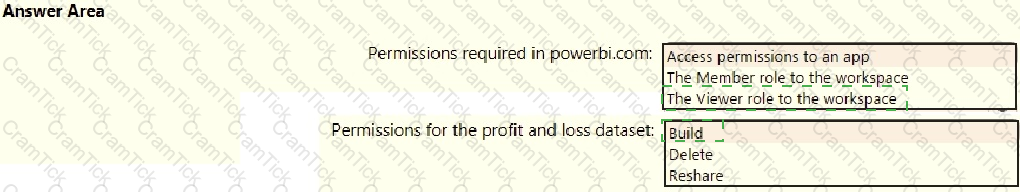
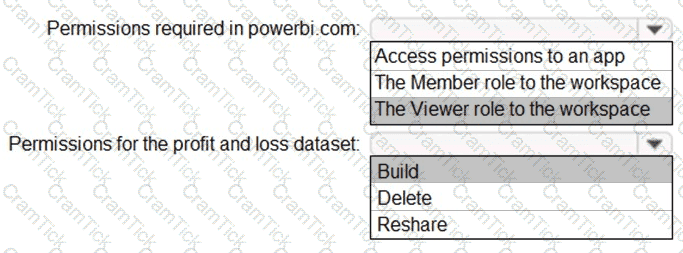
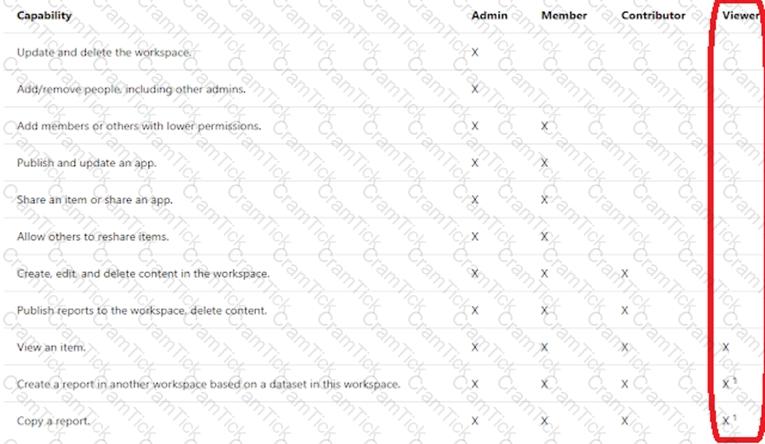
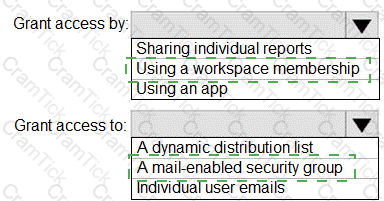
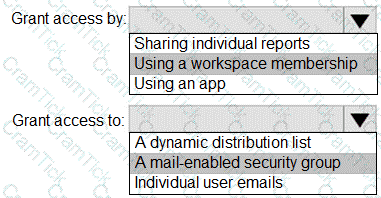
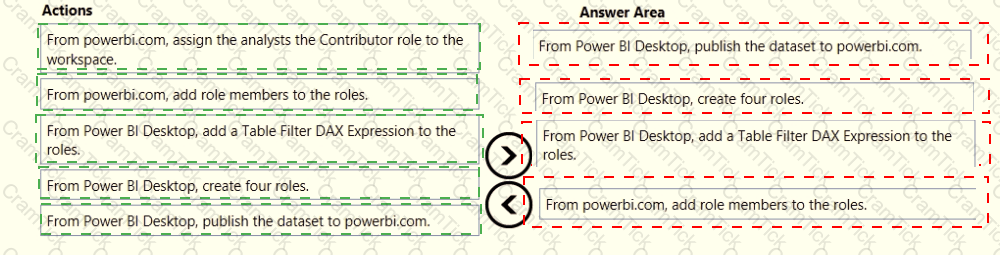
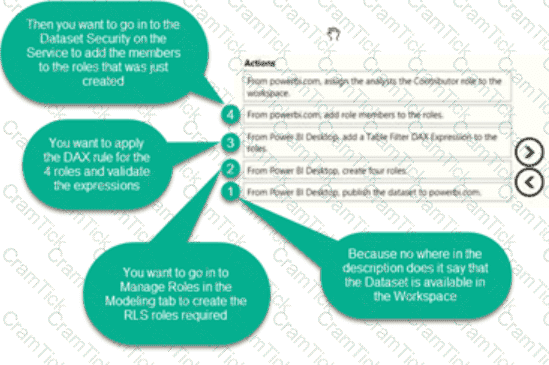
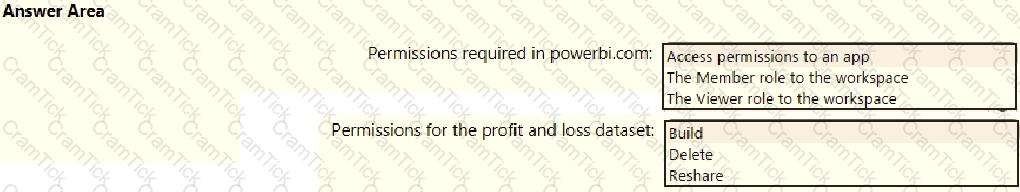
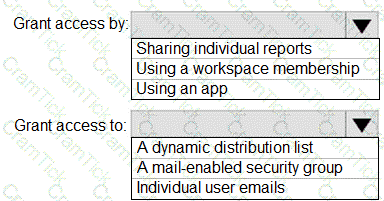
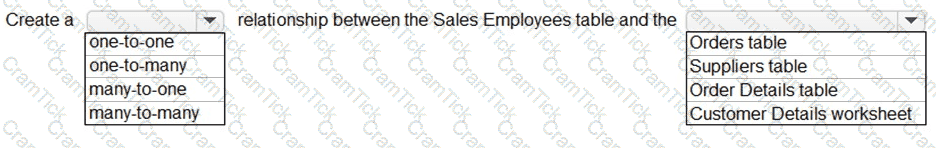
You need to grant access to the business unit analysts.
What should you configure? To answer, select the appropriate options in the answer area.
NOTE: Each correct selection is worth one point.
You need to create a relationship between the Weekly_Returns table and the Date table to meet the reporting requirements of the regional managers. What should you do?
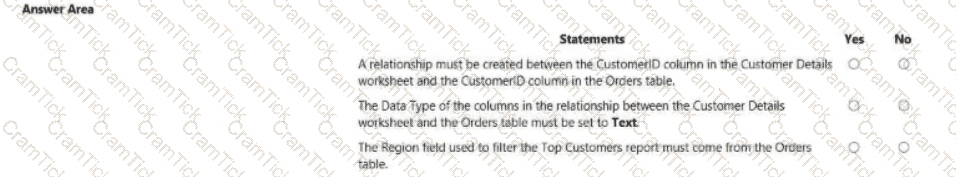
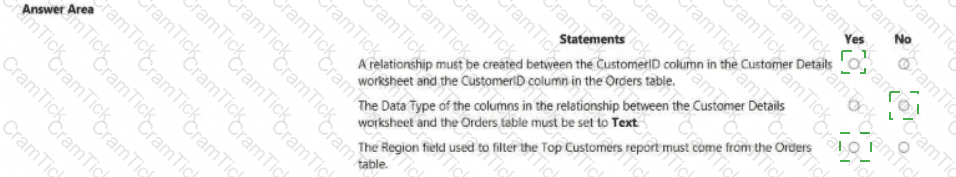
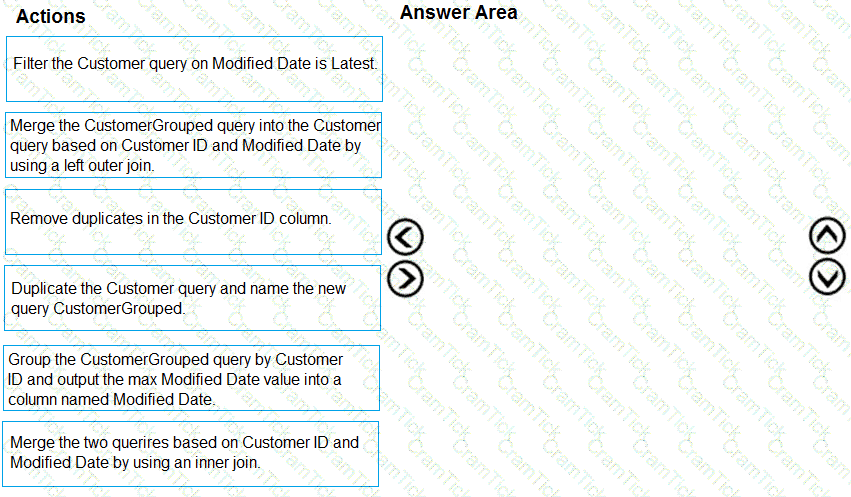
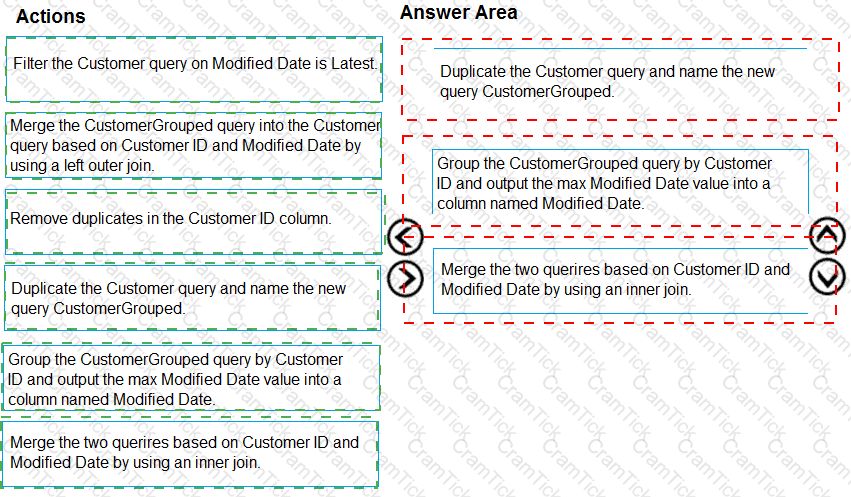
You need to create the required relationship for the executive's visual. What should you do before you can create the relationship?
You need to create a calculated column to display the month based on the reporting requirements. Which DAX expression should you use?
You need to provide a solution to provide the sales managers with the required access.
What should you include in the solution?
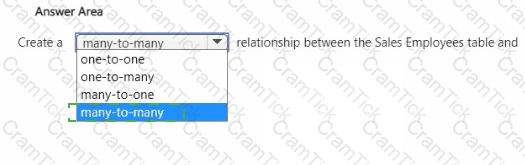
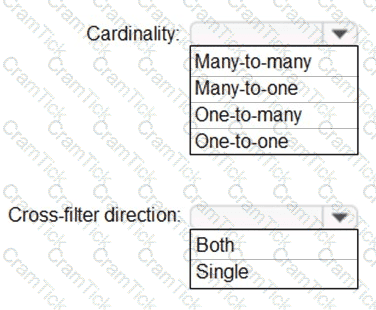
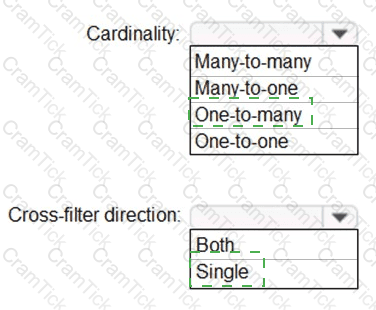
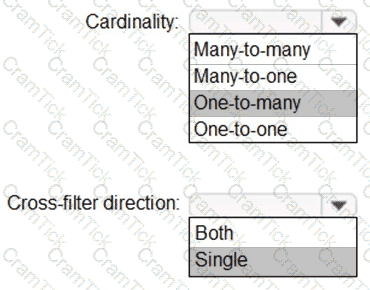
You need to create the relationship between the product list and the revenue results. The solution must minimize the time it takes to render visuals.
What should you set as the relationship cardinality?
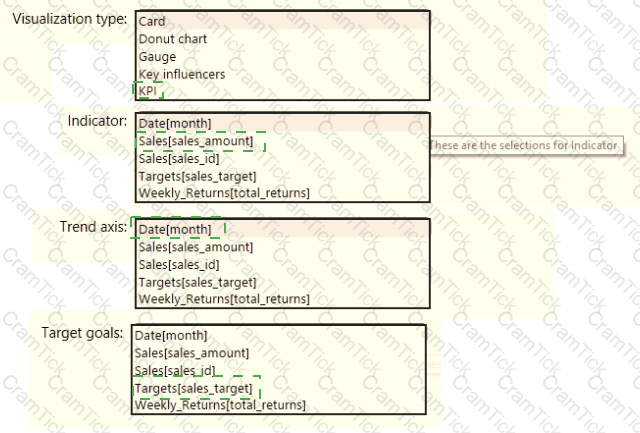
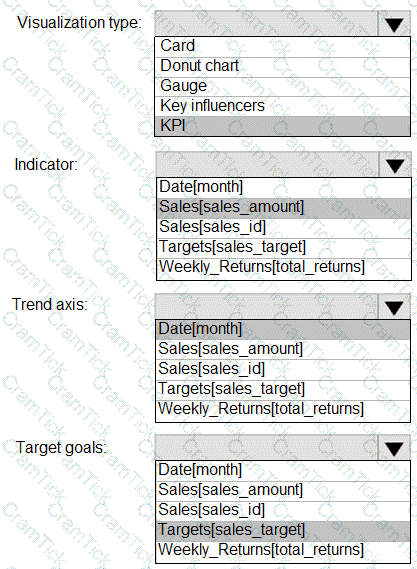
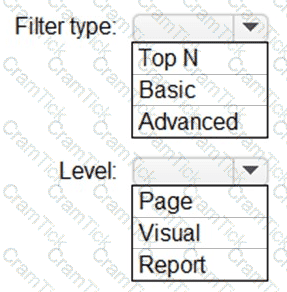
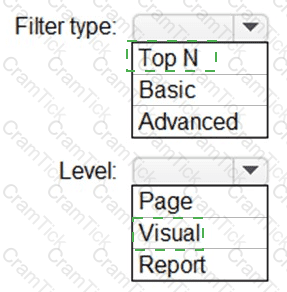
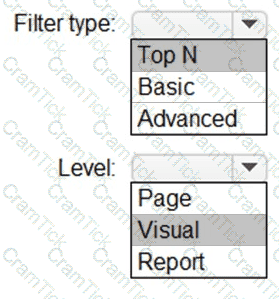
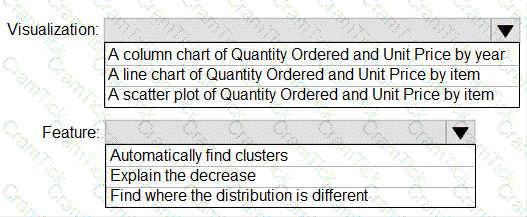
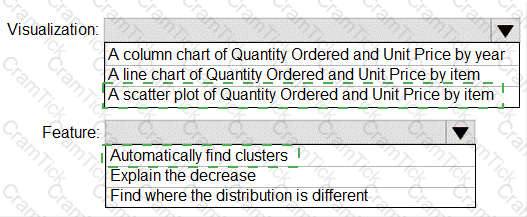
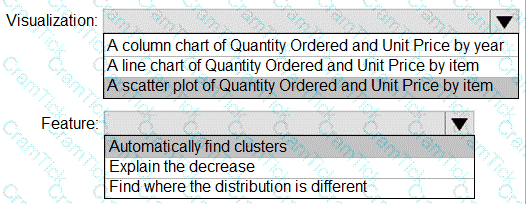
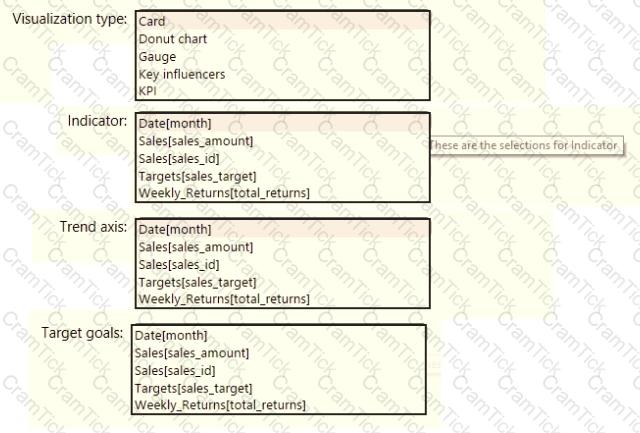
You need to create a visualization to meet the reporting requirements of the sales managers.
How should you create the visualization? To answer, select the appropriate options in the answer area.
NOTE: Each correct selection is worth one point.
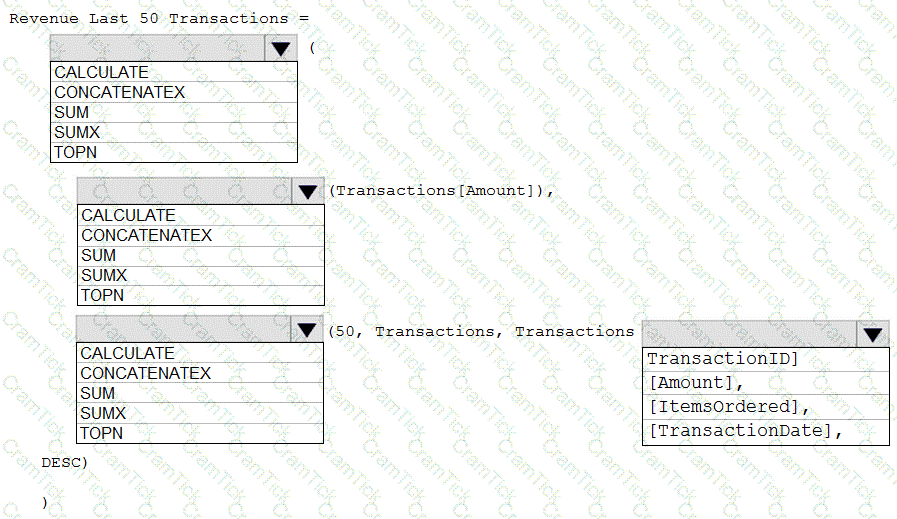
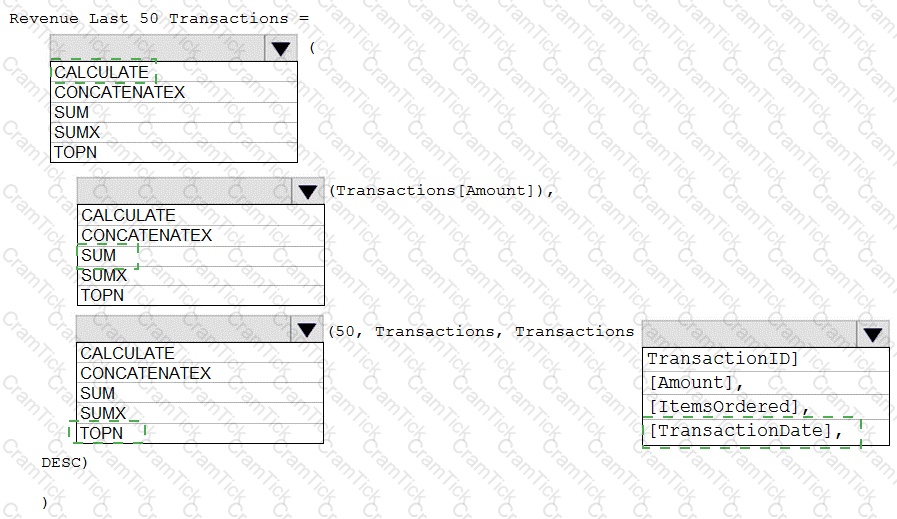
Which DAX expression should you use to get the ending balances in the balance sheet reports?
What is the minimum number of datasets and storage modes required to support the reports?
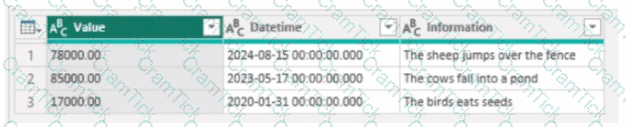
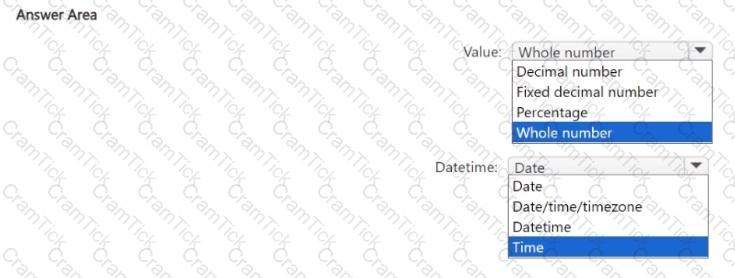
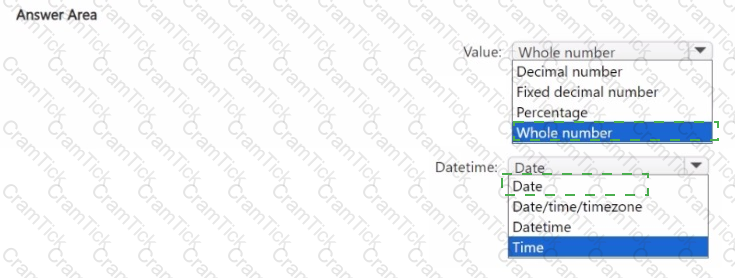
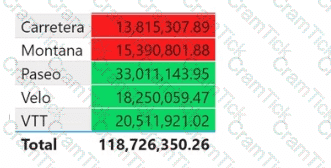
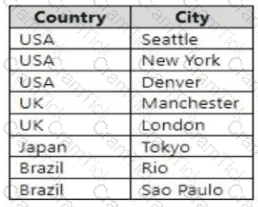
You are building a data model for a Power Bl report. You have data formatted as shown in the following table.
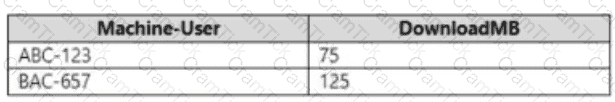
You need to create a clustered bar chart as shown in the following exhibit.
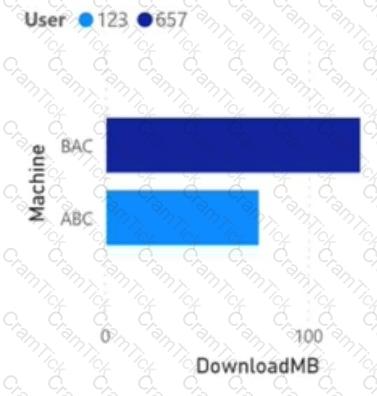
What should you do?
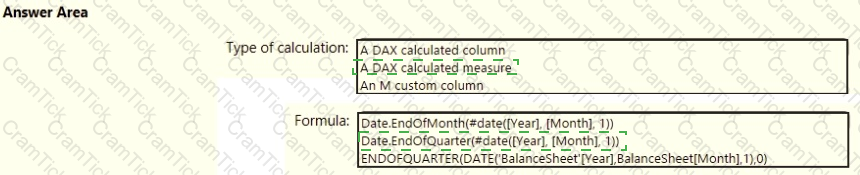
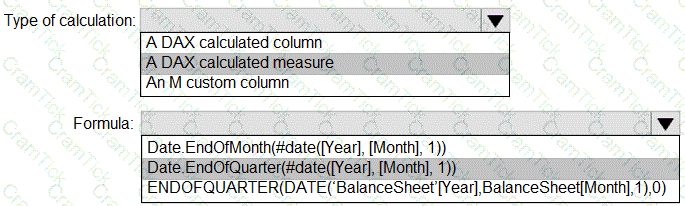
You need to calculate the last day of the month in the balance sheet data to ensure that you can relate the balance sheet data to the Date table. Which type of calculation and which formula should you use? To answer, select the appropriate options in the answer area. NOTE: Each correct selection is worth one point.

You have a Power B1 dataset that contains quarterly sales performance data.
You need to enable managers to review the data in a format that meets the following requirements:
• Is optimized for printing.
• Renders data in Microsoft Excel, Word, PowerPoint, and PDF formats.
What should you create?
You have a Power BI report that uses a dataset based on an Azure Analysis Services live connection.
You need to ensure that users can use Q&A from the Power BI service for the dataset.
What should you do?
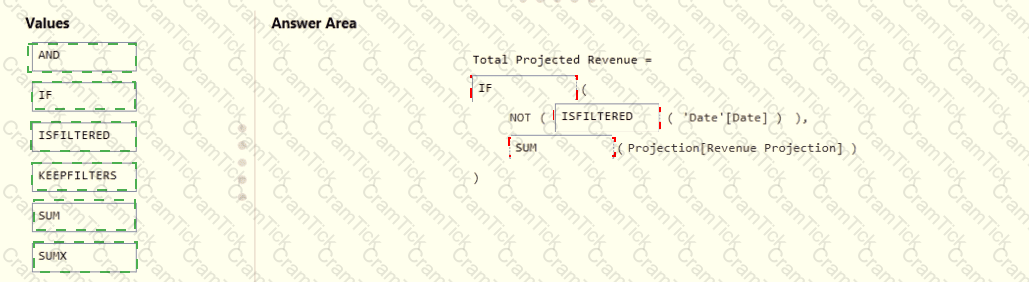
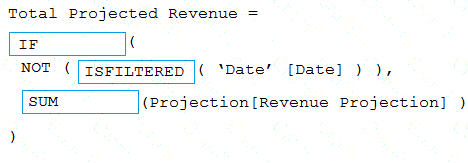
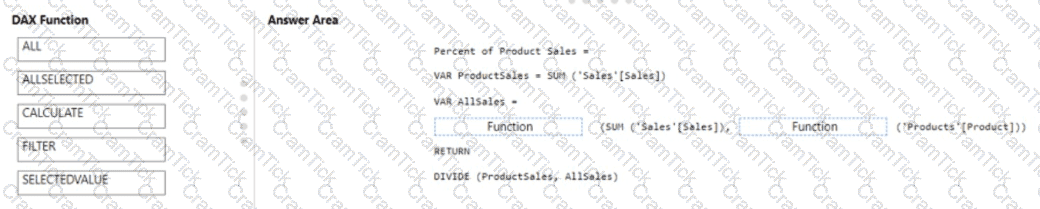
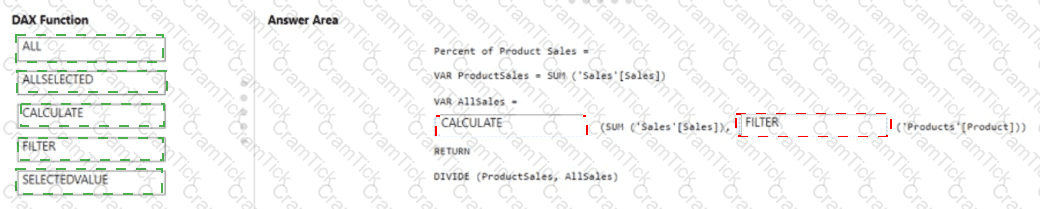
You need to create a DAX measure in the data model that only allows users to see projections at the appropriate levels of granularity.
How should you complete the measure? To answer, drag the appropriate values to the correct targets. Each value may be used once, more than once, or not at all. You may need to drag the split bar between panes or scroll to view content.
NOTE: Each correct selection is worth one point.

How should you distribute the reports to the board? To answer, select the appropriate options in the answer area.
NOTE: Each correct selection is worth one point.
You need to ensure that the data is updated to meet the report requirements. The solution must minimize configuration effort.
What should you do?
You need to create a Power BI theme that will be used in multiple reports. The theme will include corporate branding for font size, color, and bar chart formatting.
What should you do?
You use Power B1 Desktop to create a report named RPT1 that loads data from a Microsoft Excel file named File1. File1 is located in a network share.
File1 Is moved to a different folder.
When you open RPT1 in Power B1 Desktop, you discover that the report displays outdated data.
You need to ensure that the data in File1 refreshes properly.
What should you do?
You have a Power Bl semantic model named Model! that contains two fields named Sales and Quarter. Model 1 contains a DAX measure that sums the Sales column.
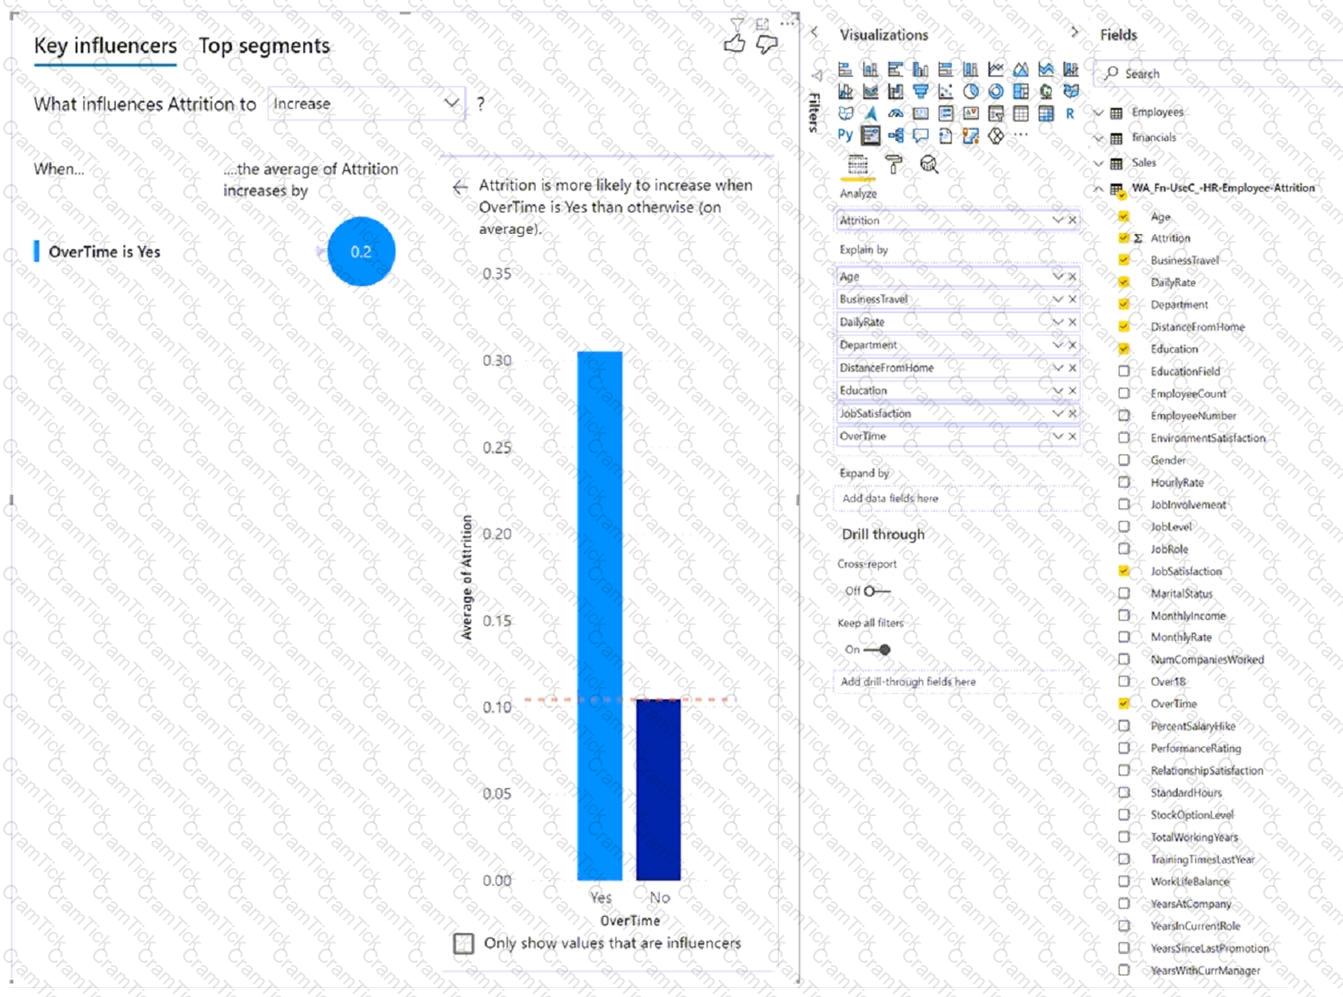
You need to create a report that will contain the visual shown in the following exhibit.
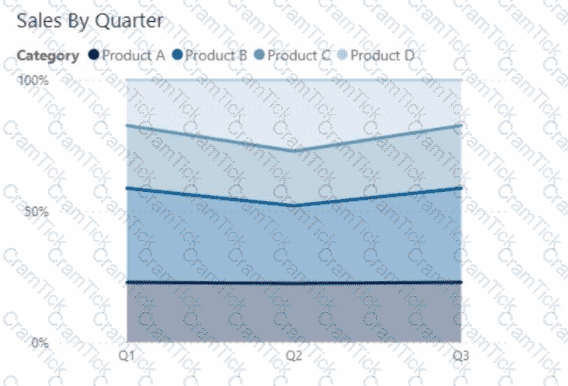
The solution must NOT require additional DAX measures.
Which type of visual should you use?
You have a Power Bl query named Sates that imports the columns shown in the following table.
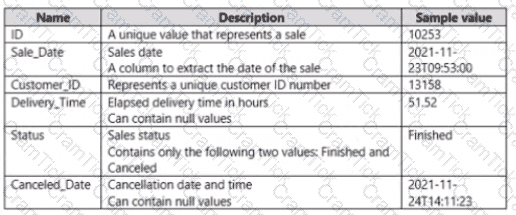
Usees only use the dale part of the Sales.Date field. Only rows with a Status of Finished are used in analysis.
You need to reduce the load times of the query without affecting the analysis.
Which two actions achieve this goal? Each correct answer presents a complete solution.
NOTL Each correct selection is worth one pant.
You have a PBiX file that imports several tables from an Azure SQL database.
The data will be migrated to another Azure SQL database.
You need to change the connections in the PBIX file. The solution must minimize administrative effort.
What should you do?
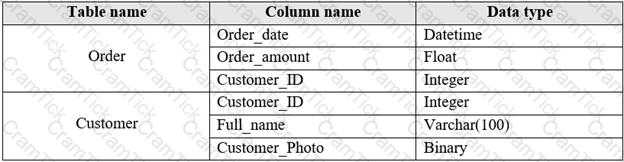
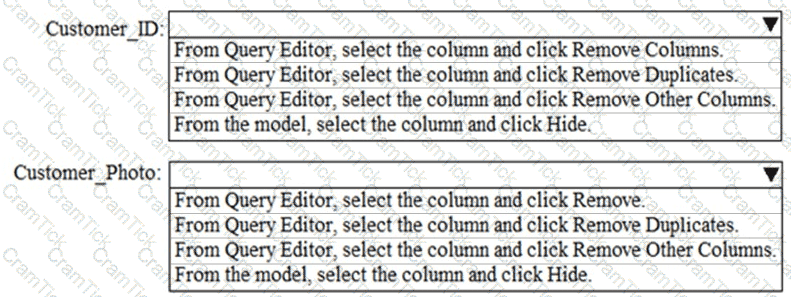
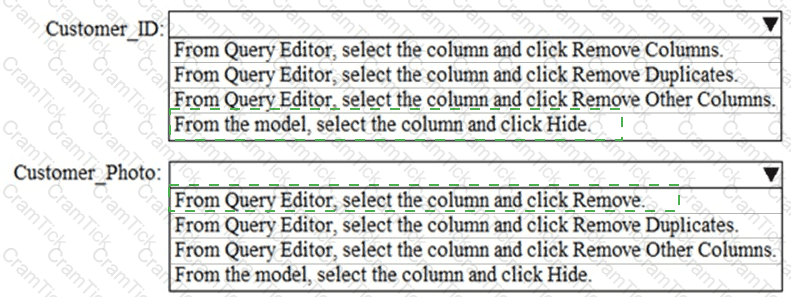
You need to minimize me size of the dataset. The solution must meet the report requirements What should you do?
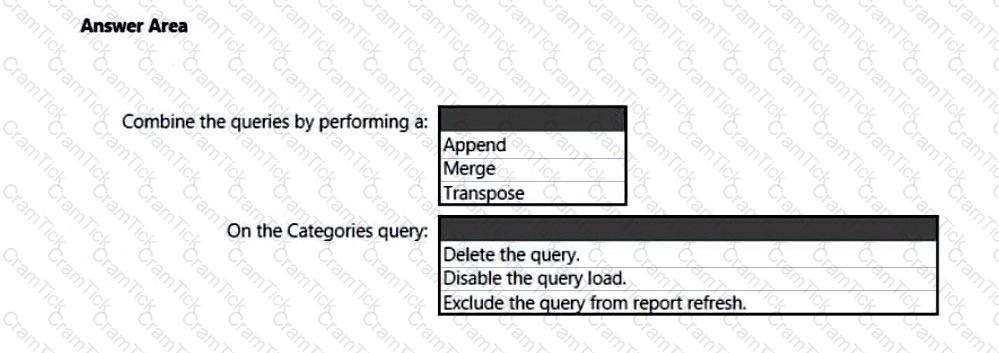
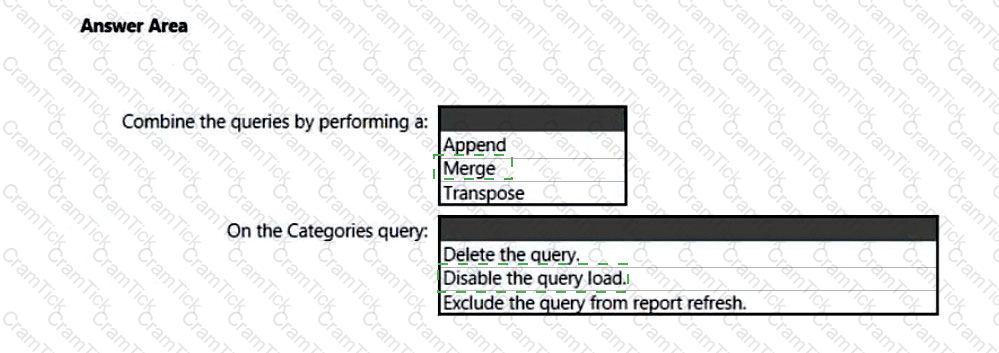
You use Power Query to import two tables named Order Header and Order Details from an Azure SQL database. The Order Header table relates to the Order Details table by using a column named Order ID in each table.
You need to combine the tables into a single query that contains the unique columns of each table.
What should you select in Power Query Editor?
You need to create a solution to meet the notification requirements of the warehouse shipping department.
What should you do? To answer, select the appropriate options in the answer area.
NOTE: Each correct select is worth one point:

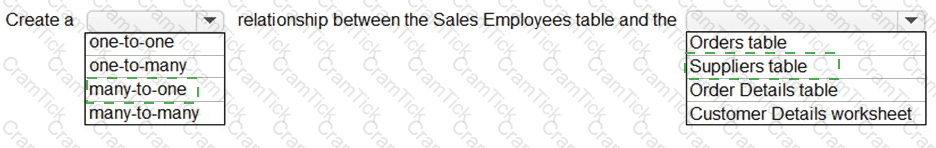
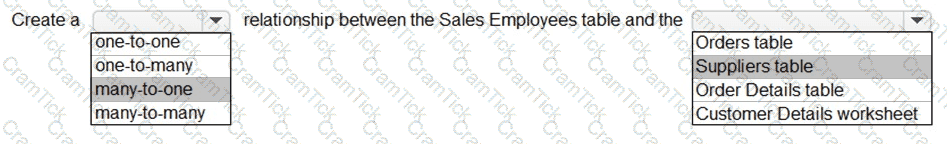
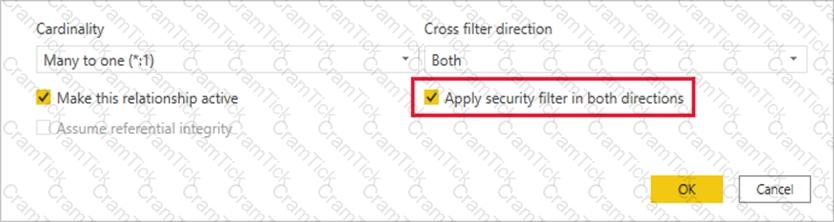
You need to create a relationship in the dataset for RLS.
What should you do? To answer, select the appropriate options in the answer area.
NOTE: Each correct selection is worth one point.
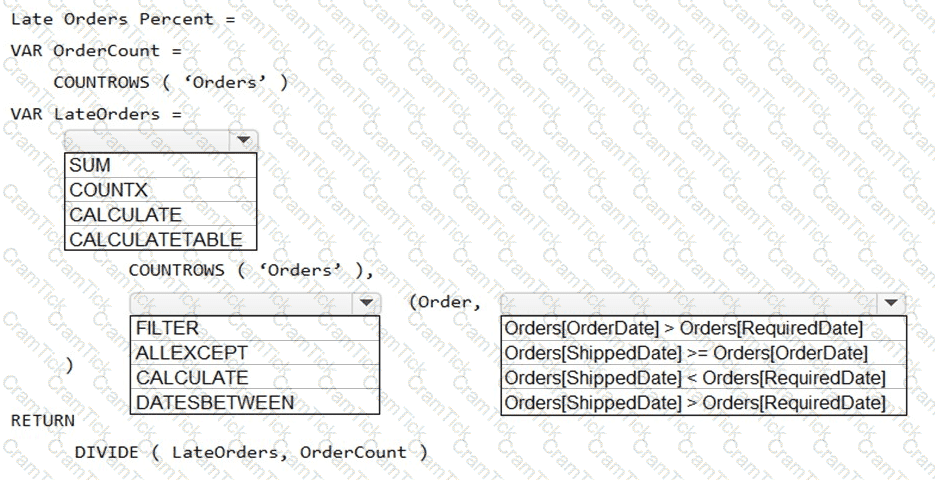
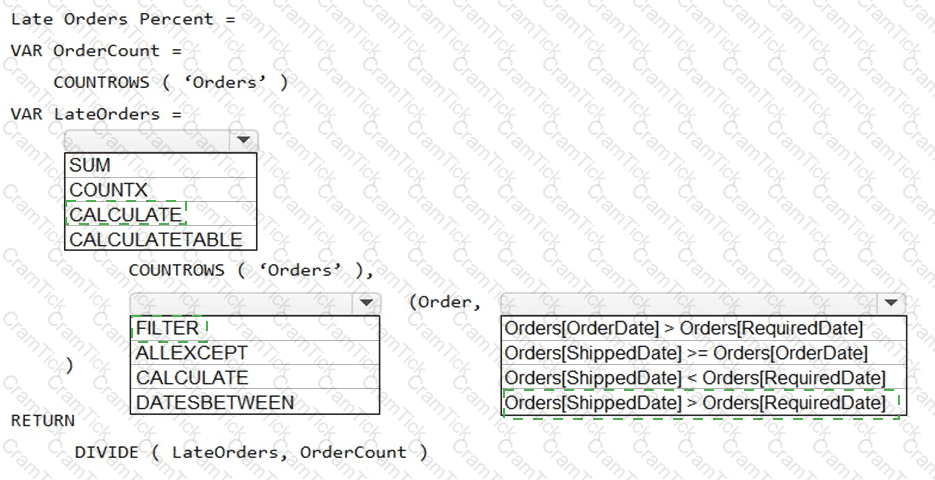
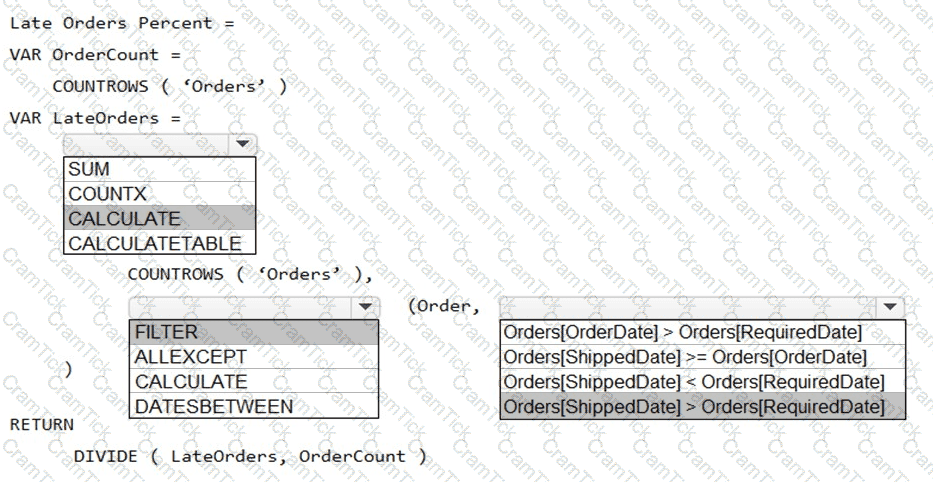
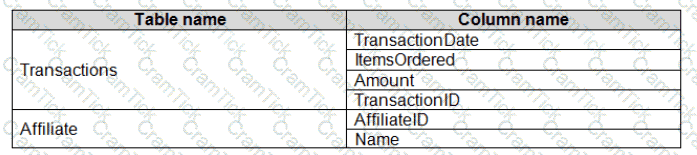
You need to create a measure that will return the percentage of late orders.
How should you complete the DAX expression? To answer, select the appropriate options in the answer area.
NOTE: Each correct selection is worth one point.