From the desktop, open the NYC
Property Transactions workbook.
You need to record the performance of
the Property Transactions dashboard in
the NYC Property Transactions.twbx
workbook. Ensure that you start the
recording as soon as you open the
workbook. Open the Property
Transactions dashboard, reset the filters
on the dashboard to show all values, and
stop the recording. Save the recording in
C:\CC\Data\.
Create a new worksheet in the
performance recording. In the worksheet,
create a bar chart to show the elapsed
time of each command name by
worksheet, to show how each sheet in
the Property Transactions dashboard
contributes to the overall load time.
From the File menu in Tableau Desktop,
click Save. Save the performance
recording in C:\CC\Data\.
From the desktop, open the CC workbook.
Open the Incremental worksheet.
You need to add a line to the chart that
shows the cumulative percentage of sales
contributed by each product to the
incremental sales.
From the File menu in Tableau Desktop, click
Save.
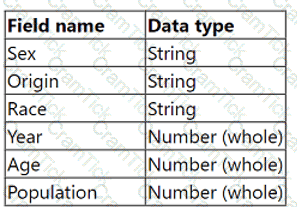
A Tableau consultant tasked with evaluating a data structure is handed the below sample dataset.
Which two statements are true about the dataset? Choose two.
A consultant plans a Tableau deployment for a client that uses Salesforce. The client wants users to automatically see Tableau views of regional sales filtered
by customer as soon as the users sign into Salesforce.
Which approach should the consultant use to deliver the final visualization?
From the desktop, open the CC workbook.
Open the City Pareto worksheet.
You need to complete the Pareto chart to show the percentage of sales compared to the percentage of cities. The chart must show references lines to visualize how the data compares to the Pareto principle.
From the File menu in Tableau Desktop, click Save.
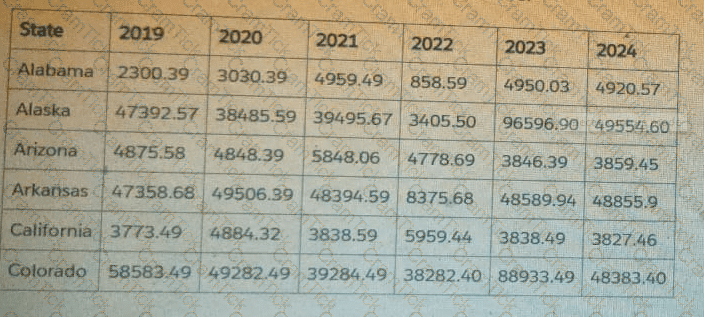
From the desktop, open the CC workbook. Use the US Population Estimates data source.
You need to shape the data in US Population Estimates by using Tableau Desktop. The data must be formatted as shown in the following table.
Open the Population worksheet. Enter the total number of records contained in the data set into the Total Records parameter.
From the File menu in Tableau Desktop, click Save.
From the desktop, open the CC workbook.
Open the Manufacturers worksheet.
The Manufacturers worksheet is used to
analyze the quantity of items contributed by
each manufacturer.
You need to modify the Percent
Contribution calculated field to use a Level
of Detail (LOD) expression that calculates
the percentage contribution of each
manufacturer to the total quantity.
Enter the percentage for Newell to the
nearest hundredth of a percent into the
Newell % Contribution parameter.
From the File menu in Tableau Desktop, click
Save.
A client is concerned that a dashboard has experienced degraded performance after they added additional quick filters. The client asks a consultant to improve performance.
Which two actions should the consultant take to fulfill the client's request? Choose two.
A Tableau consultant is asked to evaluate a workbook that is slow to respond and make a recommendation on possible performance improvements. The workbook connects to three extract data sources from an SQL database. The sheets are used in five dashboards. The consultant runs a performance recording on the workbook and notices that the largest amount of time is spent on rendering the visualizations.
What is the most effective approach to reduce the workbook's rendering time?
A shipping clerk wants to use a Sankey diagram to analyze the flow of goods between different categories, shipping modes, and locations to spot bottlenecks and optimize the most critical paths. The company uses Tableau Cloud.
How should the shipping clerk create a chart that depicts the above information?
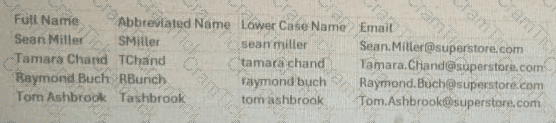
A data analyst sets up a calculation to filter a dashboard so that it displays only the users' information. The dashboard will then be published to Tableau Cloud.
The data analyst plans to use the following calculation to filter the data: USERNAME() = [Correct Answer]
Which column in the table below should the data analyst reference in the calculation?
A client has a sales dataset that contains fields named Customer ID, Region, Item, and Sales Amount. Each row represents a single sale. There may be multiple sales for each Customer ID.
The client wants to visualize the average total customer sales by region.
Which Level of Detail (LOD) expression should a consultant recommend?
A client needs to design row-level security (RLS) measures for their reports. The client does not currently have Tableau Data Management Add-on, and it
may be an option in the future.
What should the consultant recommend as the safest and easiest way to manage for the long term?
For a new report, a consultant needs to build a data model with three different tables, including two that contain hierarchies of locations and products. The third
table contains detailed warehousing data from all locations across six countries. The consultant uses Tableau Cloud and the size of the third table excludes
using an extract.
What is the most performant approach to model the data for a live connection?
A client is using Tableau to visualize data by leveraging security token-based credentials. Suddenly, sales representatives in the field are reporting that they
cannot access the necessary workbooks. The client cannot recreate the error from their offices, but they have seen screenshots from the field agents. The client
wants to restore functionality for the field agents with minimal disruption.
Which step should the consultant recommend to accomplish the client's goal?
A client has a large data set that contains more than 10 million rows.
A consultant wants to calculate a profitability threshold as efficiently as possible. The calculation must classify the profits by using the following specifications:
. Classify profit margins above 50% as Highly Profitable.
. Classify profit margins between 0% and 50% as Profitable.
. Classify profit margins below 0% as Unprofitable.
Which calculation meets these requirements?
A stakeholder has multiple files saved (CSV/Tables) in a single location. A few files from the location are required for analysis. Data transformation (calculations)
is required for the files before designing the visuals. The files have the following attributes:
. All files have the same schema.
. Multiple files have something in common among their file names.
. Each file has a unique key column.
Which data transformation strategy should the consultant use to deliver the best optimized result?
A client wants to report Saturday and Sunday regardless of the workbook's data source's locale settings.
Which calculation should the consultant recommend?
A new Tableau user created a simple dashboard on Tableau Server using supply chain data. Now, the user wants to know if they created the dashboard in
accordance with specific performance best practices.
Which approach should the consultant recommend for the client to make this determination?
A client notices that while creating calculated fields, occasionally the new fields are created as strings, integers, or Booleans. The client asks a consultant if
there is a performance difference among these three data types.
What should the consultant tell the customer?
A client collects information about a web browser customers use to access their website. They then visualize the breakdown of web traffic by browser version.
The data is stored in the format shown below in the related table, with a NULL BrowserID stored in the Site Visitor Table if an unknown browser version
accesses their website.
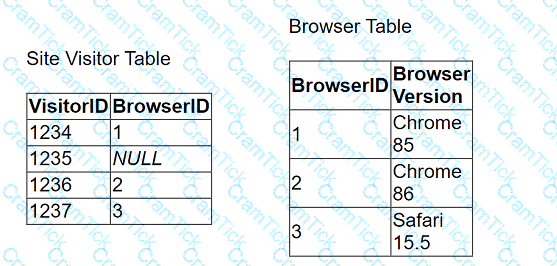
The client uses "Some Records Match" for the Referential Integrity setting because a match is not guaranteed. The client wants to improve the performance of
the dashboard while also getting an accurate count of site visitors.
Which modifications to the data tables and join should the consultant recommend?
A consultant creates a histogram that presents the distribution of profits across a client's customers. The labels on the bars show percent shares. The consultant
used a quick table calculation to create the labels.
Now, the client wants to limit the view to the bins that have at least a 15% share. The consultant creates a profit filter but it changes the percent labels.
Which approach should the consultant use to produce the desired result?
A consultant is tasked with improving the performance of a large workbook that contains multiple dashboards, each of which leverages a separate data source. What is one way to improve performance?


TESTED 05 Jul 2026