In Detailed Reporting, what functionality can be used in a calculated column? Note; There are 2 correct answers to this question.
What features are available only when you use Business Intelligence and Reporting Tools (BIRT) with Table Reports? Note: There are 2 correct answers to this question.
You want to create a page in a canvas report that includes a custom image, a user editable title centered underneath the image, and the current date in the top-right corner. Which combinations of components can you use to accomplish this? Note: There are 2 correct answers to this question.
You are creating a query for a historical compensation story report in Query Designer. You have added the Job Information table to the query, configured a scope filter, and previewed the result to verify you are returning the appropriate employees. You add the related table Compensation to the query.
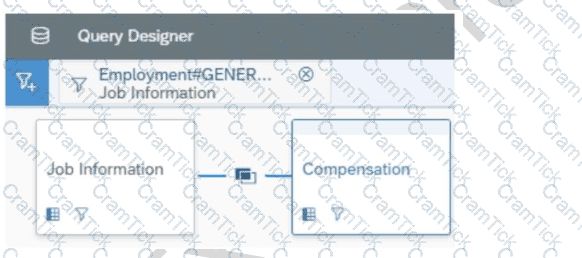
When you preview the query, you only get the current compensation information for the employees. Why do you only receive the current records? Note: There are 2 correct answers to this question.
In Query Designer, you are trying to create a conditional expression to relabel a field. You create the following expression: IF([User#Basic User Information#Gender] = "M" , "Male" : "Female") You received an error message saying the formula could NOT be computed. Which symbol in your expression is causing the error?
In a Story, which of the following would make it possible for a filter to update multiple charts using linked analysis? Note: There are 2 correct answers to this question.
Within a Story, you create a query using the Basic User Information table. After you add the Proxy Information table, you notice that some of the basic information records are NO longer displayed in the preview. How do you adjust the query to return the missing records in the preview?
When you share a canvas report, from where can the user access that report? Note: There are 2 correct answers to this question.
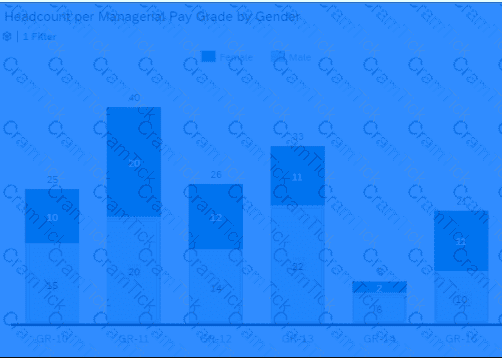
You need to create a chart of type Indicator: Numeric Point that displays the following output:
count of employees with the gender male divided by the count of employee with the gender female.
The chart can then be filtered for different departments. What calculation is required to create the metric?
In the Advanced Reporting tool, you want to create a query where the results meet the following criteria: Only show one row per employee, Only show the pay components Base Salary and Bonus, Show these pay components as individual columns. You have joined the Global Job Information table with the Compensation table.What else must you do? Note: There are 2 correct answers to this question.
What is a prerequisite for using the SuccessFactors standard canvas report templates?
When constructing an expression for a calculated column in Query Designer, which syntax should you use to enter a date?

You want to create a report that returns only employees who were born in 1961. You also want to enable the person who runs the report to specify a different birth year. How can you achieve this? Note: There are 2 correct answers to this question.
Select Date Options from the Toolbar. Set Date Type to Show All. Select Manage Run Time Filters from the Toolbar. Expand Personal Information table. Select Date of Birth column. Select OK.
A report consumer claims that a canvas report shared with them is NO longer available in Report Center. Upon your investigation, you find the report has been deleted. You need to reproduce the report as quickly as possible. What action do you take?
In a live data query, what are user-prompted filter types? Note: There are 2 correct answers to this question.
Which tool can you use to upload a report from the test instance to the production instance? Note: There are 2 correct answers to this question.
A table report is shared with a user. That user CANNOT see the table report in the Report Center list. Which role-based permission has NOT been set correctly for this user?
What happens when you enable inline translation of a Story as it relates to future edits of the Story report? Note: There are 2 correct answers to this question.
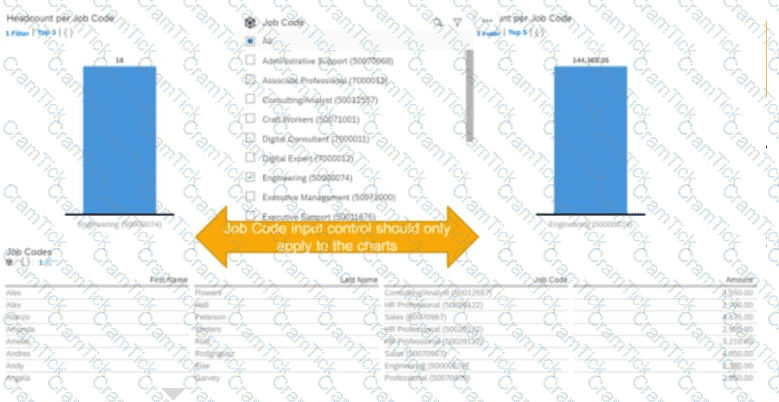
You are creating a Story report on Job Classifications. You have configured the chart, table, and input control on the canvas, as displayed in the screenshot. How do you set the input control?


TESTED 02 Jan 2026